Investors Eye Juniper Networks: Analyzing Put Options Strategy
Investors considering a purchase of Juniper Networks Inc (Symbol: JNPR) may be apprehensive about the current market price of $36.58 per share. One alternative strategy they might find worthwhile is selling puts, particularly the November put option with a $33 strike price. As of this writing, the bid stands at $1.25, which translates to a 3.8% return against the $33 commitment. This equates to an annualized rate of return of 6.9%, making it an attractive option for some investors.
### Evaluating the Put Selling Strategy
Opting to sell a put does not provide access to JNPR’s upside potential as owning shares would. The put seller only acquires shares if the contract is exercised. The buyer would only exercise the contract at the $33 strike if it offers a better outcome than selling at the current market price. Specifically, unless Juniper Networks’ shares drop by 9.8%, leading to the exercise of the contract—resulting in a cost basis of $31.75 per share after accounting for the $1.25 premium—the put seller’s gain is limited to the collected premium reflecting a 6.9% annualized return.
### Dividend Yield Comparison
When comparing returns, it’s essential to note that the annualized 6.9% return from the put option exceeds Juniper Networks’ 2.4% annualized dividend yield by 4.5%, based on the present share price. If an investor buys stock solely for dividends, they face more risk, as the stock would need to decline by 9.84% to reach the $33 strike price.
### Dividend Considerations
While discussing dividends, it’s crucial to recognize that they can fluctuate and are tied to the company’s profitability. Reviewing Juniper Networks’ dividend history can provide insights into the likelihood of sustaining the current 2.4% annualized yield.

### Analyzing Price History
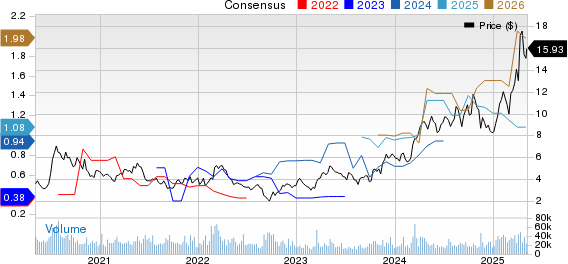
The accompanying chart illustrates Juniper Networks’ trailing twelve-month trading history, highlighting the $33 strike point against that backdrop.

By combining this historical chart with a fundamental analysis of Juniper’s financials, investors can better assess whether selling the November put at the $33 strike for a 6.9% annualized return is worth the associated risks. The trailing twelve-month volatility for Juniper Networks is calculated at 15%, taking into account the last 249 trading days.
### Market Overview and Trading Patterns
In mid-afternoon trading on Monday, put volume among S&P 500 components totaled 810,250 contracts, mirroring call volume for a put:call ratio of 0.72. This figure is higher than the long-term median put:call ratio of 0.65. This suggests a greater number of put buyers than typically expected in today’s options market.
![]()
![]() Top YieldBoost Puts of the S&P 500 »
Top YieldBoost Puts of the S&P 500 »
Additional Insights:
– Auto Dealerships Dividend Stocks
– WORK Market Cap History
– Top Ten Hedge Funds Holding NMA
The views and opinions expressed herein are those of the author and do not necessarily reflect those of Nasdaq, Inc.