TradeSmith Predicts Major Market Melt-Up Opportunity Ahead
A rare market signal is flashing—here’s how to profit from it quickly.
Editor’s Note: Geopolitical uncertainty, tariffs, mixed earnings results, and stalled price action have complicated the financial landscape this year.
However, our partners at TradeSmith are confident about what lies ahead.
They predict the continuation of an epic melt-up that started in April last year, likely accelerating over the next 12 months.
Today, TradeSmith CEO Keith Kaplan joins us to explain how they arrived at this conclusion and share the strategies he utilizes to capitalize on stocks in sharp downtrends.
Take it away, Keith…
Many investors caution against trying to “catch a falling knife.”
This principle holds true—unless you have a solid plan.
With the right stocks in mind, buying into a downtrend and anticipating a reversal can be highly rewarding.
A couple of months ago, we developed a system designed for this scenario. Think of it like catching a falling knife with Kevlar gloves—where we lower the risk and target only the most promising setups with a proven track record.
After extensive testing, we pinpointed a unique combination that generates a rare yet reliable trading signal.
By concentrating on quality stocks undergoing sudden, steep downtrends, we aim for a quick return to normalcy, propelling their prices higher after your entry point.
Why Take Action Now?
First, this signal will soon be available in TradeSmith Finance for Trade360, Ideas by TradeSmith, and Platinum subscribers. We want investors poised to secure substantial gains, as TradeSmith is currently detecting an ultra-rare bullish signal in the markets—one that appears only every few decades.
This signal is central to our entire strategy.
Our data indicate we are experiencing a unique market scenario reminiscent of 1996 and even earlier in 1926. Investors with historical insight recognize these periods marked the onset of significant market manias that extended much longer than anticipated.
These movements were fueled by technological advancements, financial institutions making it easier for smaller investors to participate, and a consumer credit revolution that boosted the economy.
We are observing similar beginnings today, suggesting the onset of a “mega melt-up.”
In these market conditions, stocks often enjoy remarkable gains year after year.
For instance, the S&P 500 gained over 20% annually from 1996 to 1999, only to burst in September 2000. The Nasdaq performed even better, posting returns of 42%, 20%, 83%, and 102% over that same four-year span.
Notably, individual stocks experienced extraordinary surges, with Microsoft (MSFT) soaring over 1,000%, Oracle (ORCL) over 1,200%, and Amazon (AMZN) peaking at an astonishing 8,509% from 1997 to 1999.
However, it’s crucial to remember that every melt-up eventually transitions into a meltdown.
This has been true through history, as seen when the Roaring ‘20s ushered in the Great Depression or when the dot-com bubble crashed.
Regardless of whether we are in a boom, bubble, or bust phase of a melt-up, our strategy is ideal for capturing quick gains when stocks rebound from sharp sell-offs.
Stay tuned for more details in a brand-new presentation later this week.
How This New Strategy Delivers Rare, Powerful Gains
Setups from our new strategy are infrequent and rarely occur among stocks with a low Volatility Quotient (VQ). For new readers, VQ measures a stock’s individual volatility; a higher score indicates greater volatility and vice versa.
This correlation makes sense—high-quality stocks typically do not experience drastic declines as the market rewards strong companies with elevated share prices.
Occasionally, however, disappointing earnings results or unexpected macroeconomic events can trigger significant drops in these stocks. That’s when we want to step in and buy.
We rigorously back-tested this new strategy using the S&P 500 over the past decade.
Out of 339 identified instances—approximately one-third occurring during the initial sell-off in March 2020—nearly 80% showed positive returns after 21 trading days. The average return, combining gains and losses, was around 16%.
This presents a strong signal with impressive short-term returns, making it an attractive swing-trading strategy.
While I cannot divulge the precise parameters of this strategy, to ensure it remains exclusive to our subscribers, I can share an example.
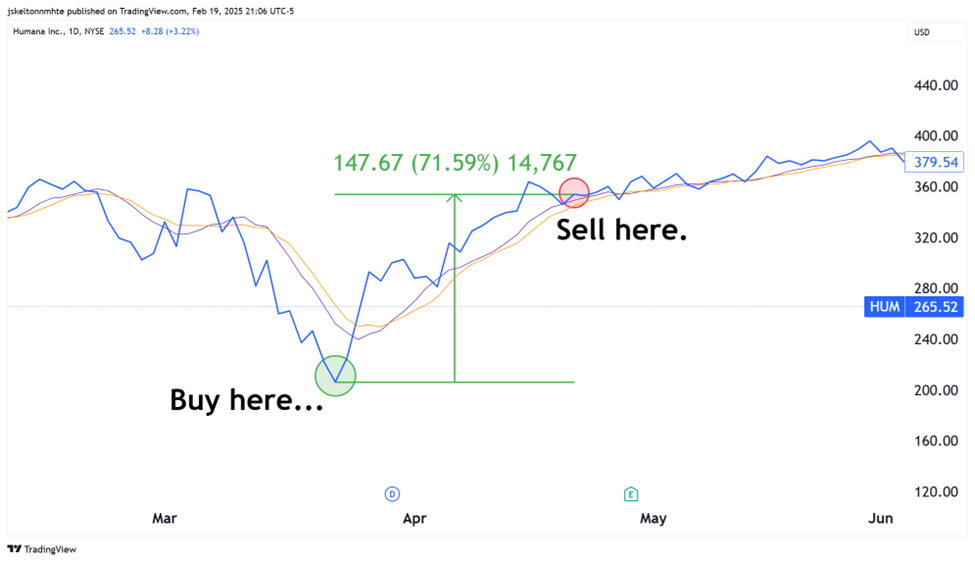
During our back-testing, we identified a trade involving Humana (HUM) during the pandemic crash.
The Snapback signal activated for HUM at $206.99 on March 23, 2020. At that moment, purchasing the stock might have seemed unwise.
However, holding it for 21 trading days would have yielded a 71.6% return as the stock rebounded to $355.18:

Unpacking Successful Stock Recovery Signals in Unstable Markets
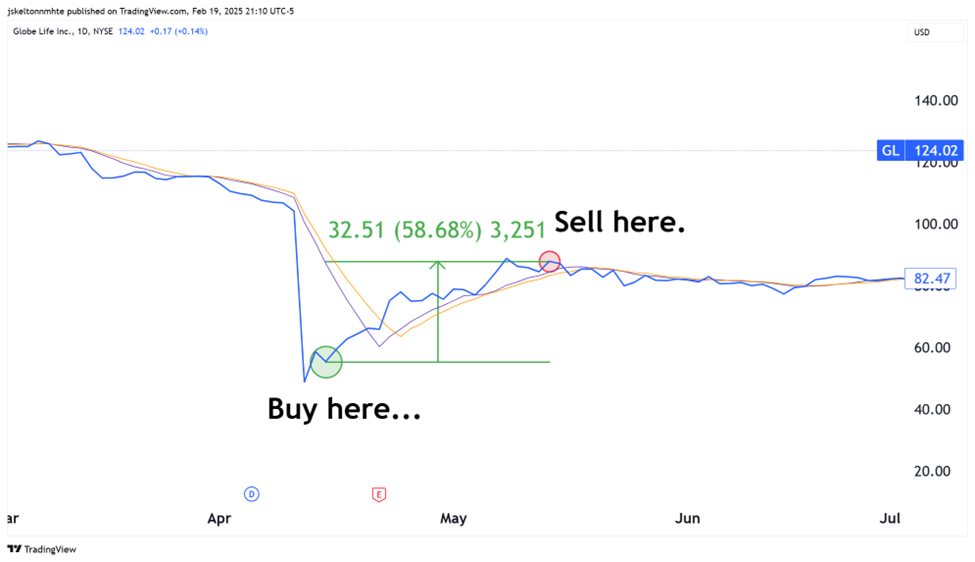
The pandemic saw many stocks experiencing remarkable volatility. Among these, the case of Globe Life (GL) from last year provides a noteworthy example.
After a short report accused GL of insurance fraud, its stock plummeted over 50% in one day, reaching $55.52 on April 15. This dramatic drop triggered a Snapback signal, suggesting a potential recovery.
Within just 21 trading days, GL’s stock rebounded to $88.10, resulting in a remarkable 58.7% return, illustrated in the chart below:
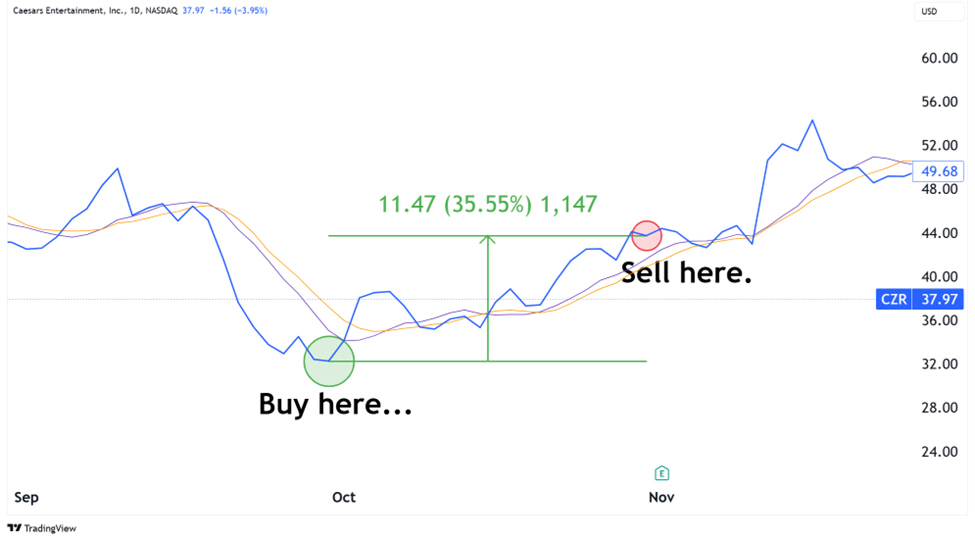
In another instance, Caesars Entertainment (CZR) showcased a clear opportunity in 2022. The signal emerged at $32.36 on September 30, leading to an impressive 35.5% gain by October 31, when shares were valued at $43.73:
These examples illustrate some of the strongest performers identified by the signal system over the past decade. However, it’s important to mention that not all signals resulted in gains. In our study, only 20% of the signals led to losses, showing a considerable degree of reliability in this trading strategy.
If you’re curious about these strategies, there’s an exciting opportunity currently available.
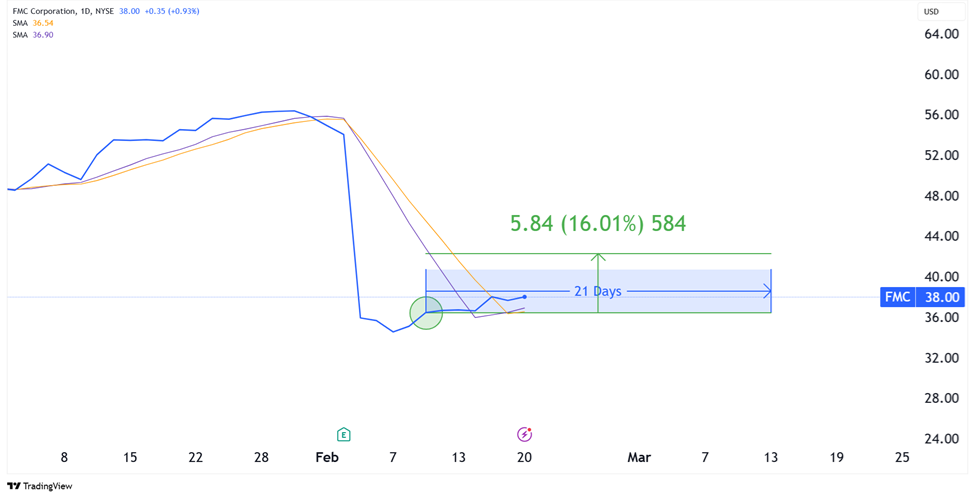
A Tradable Signal on FMC
Here’s a look at FMC Corp. (FMC), which is showing promising trading signals:
This signal could present a valuable trading opportunity for investors looking to capitalize on market movements.
New Trading Signal for FMC: Short-Term Opportunities Ahead
On February 11, a new trading signal emerged for FMC, creating a potential opportunity. According to our system, the optimal strategy involved purchasing FMC on that date and holding it through March 13, covering 21 trading days. Although this trade window is closing, it remains the latest signal generated by our analysis.
Fortunately, FMC’s price has remained relatively stable and has shown slight upward movement since the signal. Investors can consider buying FMC this Monday, targeting a sell as the price approaches the average gain of approximately 16% from our historical backtesting. This projection represents a noteworthy return even with only 12 trading days remaining.
It’s crucial to note that FMC is currently categorized as being in the Red Zone. This classification implies that it is not yet suitable for a long-term buy-and-hold strategy. The context here involves short-term trading, allowing for potential gains as the stock recovers from its recent price decline.
We plan to roll out this strategy to our Trade360, Ideas by TradeSmith, and TradeSmith Platinum subscribers soon. Once available, subscribers will receive new entry signals from this method and can choose to participate if they wish. As market conditions align, we may be entering another “Roaring ‘20s” era for the stock market, hinting at numerous exciting trading prospects if the current momentum continues.
In advance of this rollout, I will be hosting a free demonstration highlighting how to identify 10 “melt-up stocks” that fit the current advantageous market conditions. Click here to reserve your seat for my Last Melt-Up event on Thursday, February 27, at 8 p.m. Eastern.
Best regards,
Keith Kaplan
CEO, TradeSmith
Frequently Asked Questions (FAQs)
1. What is this low-risk, high-reward strategy?
This strategy identifies high-quality stocks that are experiencing steep downward trends but have a history of recovering quickly.
2. How reliable is this trading approach?
Historical backtests indicate that nearly 80% of trades yielded profits, averaging a return of 16% over a 21-day period.
3. Why is this market signal significant now?
This signal has only appeared twice in the last century, both times preceding substantial market booms.
4. What stocks have worked with this strategy before?
Previously successful stocks using this strategy include Humana (HUM), Globe Life (GL), and Caesars Entertainment (CZR), each delivering strong returns.
5. How can I access real-time signals for this strategy?
TradeSmith is working to integrate this strategy for subscribers, providing live trading opportunities.