Market Signals Point to Strong Bullish Reversal Ahead
This isn’t just another buy-the-dip signal; it’s more significant than that.
Recently, the market didn’t just whisper; it roared.
A Zweig Breadth Thrust—a rare and reliable technical indicator—has triggered. If you’re familiar with market history, you know how important this is. If not, prepare for potential market movement.
This signals the beginning of substantial buying opportunities.
What is the Zweig Breadth Thrust?
The late Marty Zweig, a notable market strategist of the 20th century, created this indicator to signal when bearish market sentiments diminish, indicating a robust bullish reversal.
Here’s how it operates:
- It tracks the 10-day moving average of advancing stocks on the NYSE.
- The signal activates when that average climbs from below 40% to above 61.5% within 10 days.
This scenario unfolded yesterday.
Implications of the Thrust
Since World War II, the Zweig Breadth Thrust has occurred only 18 times. The outcomes have been consistent:
- The market rose six months later every time.
- The market also increased 12 months later without exception.
The average return 12 months following a Zweig Thrust is +25%.
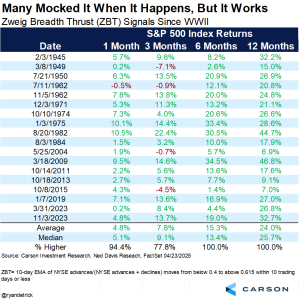
Consider this: 18 for 18. Zero false signals and significant gains have consistently followed.
Additional Bullish Signals
Not only is the Zweig Breadth Thrust indicating bullish trends; additional signals are also emerging, creating a robust positive outlook.
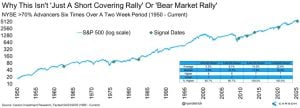
70% Advancers Signal
In the last 10 trading sessions, six have shown more than 70% of stocks on the NYSE closing higher.
This is an uncommon occurrence. Since 1950, it has only happened seven times before.
After each of these instances:
- Stocks rose six months and 12 months later.
- The average return during the 12-month period was +23%.
This behavior showcases when broad-based institutional buying resumes, lifting the entire market rather than just a few leading stocks.
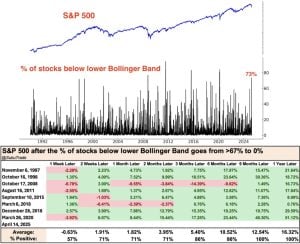
Bollinger Band Reversal
Two weeks ago, over 70% of S&P 500 stocks were trading below their lower Bollinger Band, which indicates that they were oversold. Bollinger Bands measure price volatility and unusual market conditions.
As of now, every stock in the S&P 500 has rebounded and is no longer below the lower Bollinger Band.
This rapid turnaround has occurred only a few times since 1990, leading to the following historic outcomes:
- Stocks were higher 12 months later every time.
- The average gain during that period was +16%.
The combination of these indicators suggests a strong bullish sentiment is taking hold in the market, which could present significant investment opportunities moving forward.
Market Signals Indicate Strong Potential for Upcoming Gains
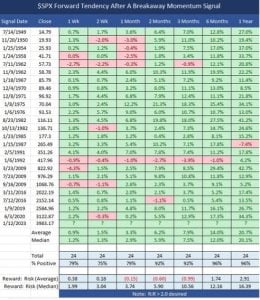
Breakaway Momentum Signals Nearing Activation
The Breakaway Momentum Breadth Thrust is close to being triggered, following a strong historical pattern.
Here’s the setup:
- This signal activates when the 10-day ratio of advancing to declining stocks surpasses 1.97.
- Such occurrences have only been documented a few dozen times since World War II.
- When triggered, stocks went up 95% of the time within 12 months.
- The average return from these instances is around +21%.
Currently, we are this close to hitting the Breakaway Momentum Breadth Thrust:
- Triggering requires 1,660 net advancing stocks today.
- Alternatively, reaching 3,030 net advancers across today and Monday will also trigger it.
This target is achievable, and market momentum suggests it could happen soon.
Fundamentals Supporting Market Growth
Technical signals align closely with macroeconomic trends, indicating a favorable environment for bulls.
Recent changes in trade dynamics suggest improved conditions. Tariff tensions that arose in early April have since eased significantly. The U.S. effective tariff rate has decreased from 27% to approximately 20% in just three weeks. Positive discussions regarding potential trade agreements with Japan, India, Vietnam, and others are underway, with a China deal potentially in the pipeline for May or June, possibly driving average tariffs down to around 10%.
This shift in trade policy is encouraging and likely to remain favorable.
In addition, the Federal Reserve is signaling a possible return to rate cuts. Cleveland Fed President Beth Hammack remarked that if data supports it, rate cuts could occur as early as June. This prospect seems favorable, particularly with trade tensions easing and inflation rates declining. A cycle of rate cuts could extend into the end of the year.
Importantly, corporate earnings continue to show strength. The first-quarter earnings reports have started strong, with Alphabet (GOOG) posting exceptional results fueled by AI spending, robust advertising demand, and solid cloud performance. Early results from companies like Texas Instruments (TXN) and Lam Research (LRCX) in AI infrastructure, along with firms like ServiceNow (NOW) in AI software, have been optimistic as well.
Conclusion
To summarize key points:
- Zweig Breadth Thrust has just triggered, boasting a 100% historical success rate since World War II.
- 70% Advancers Signal historically resulted in all gains over the last seven occurrences.
- Bollinger Band Reversal consistently signals 16%+ gains.
- Breakaway Momentum Thrust is nearing, with a 95% success rate.
- Tariff rates are decreasing, the Fed may pivot, and earnings remain robust.
These indicators reflect what market growth looks like.
The current environment is favorable for investors. Technical signals, fundamentals, and market trends are all urging a “buy” stance.
The Zweig Breadth Thrust is a rare opportunity for investors; historical patterns suggest significant gains follow. The last occurrence was in March 2023, just before the market’s surge tied to AI advancements.
Now, this signal appears again, potentially with even greater momentum.
It is essential not to overthink this situation.
The opportunity is clear—the market signal has activated.
On the date of publication, Luke Lango did not hold positions in the securities mentioned in this article.
For questions or comments regarding this article, please contact [email protected].