American Express Stock Overview
American Express’ stock (NYSE: AXP) has surged 21% YTD, significantly outpacing the S&P500, which rose by 10% during the same period. Trading at $228 per share, the stock currently stands 11% above its fair value of $205 according to Trefis’ estimations for American Express’ valuation.
A History of Market Outperformance
By the numbers, AXP stock has shown robust gains of 90% since early January 2021, rising from $120 to around $230 presently, while the S&P 500 managed a 40% increase over the same timeframe. Impressively, American Express has consistently outperformed the broader market for the past 3 years, with returns of 35% in 2021, -10% in 2022, and 27% in 2023. In contrast, the S&P 500 yielded returns of 27% in 2021, -19% in 2022, and 24% in 2023. Surpassing the S&P 500 continuously, particularly in volatile times, has proven challenging for many individual stocks in recent years, including financial stalwarts like JPM, V, and MA, as well as tech giants such as GOOG, TSLA, and MSFT. However, the Trefis High Quality (HQ) Portfolio, comprising 30 equities, has managed to surpass the S&P 500 each year. Curious about the secret sauce? The HQ Portfolio’s collective returns outshine the benchmark index, offering superior performance with less risk, as evidenced by its performance metrics.
Future Projections and Market Speculations
Given the prevailing macroeconomic uncertainty characterized by soaring oil prices and elevated interest rates, investors are speculating whether AXP could witness a significant upswing.
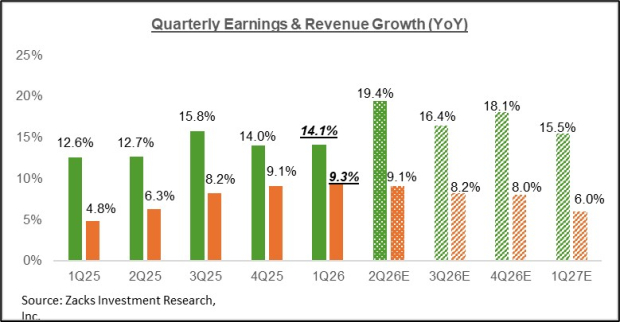
In the fourth quarter of 2023, the credit card giant fell short of street expectations. Although it reported total revenues of $15.8 billion – an 11% increase year-over-year (y-o-y), driven by a 7% growth in non-interest revenues and a 31% surge in net interest income (NII), the company saw provisions for credit losses rise unfavorably from $1 billion to $1.4 billion. As a result, adjusted net income rose by 23% y-o-y to $1.9 billion.
For the full fiscal year 2023, AXP witnessed a 14% y-o-y revenue growth to $60.5 billion, supported by a 10% uptick in noninterest revenues and a 33% jump in NII. Despite provisions more than doubling to $4.9 billion, a decrease in total expenses as a percentage of revenues from 77.8% to 74.5% helped boost adjusted net income by 12% y-o-y to $8.25 billion.
Looking ahead, American Express’ revenues are projected to reach $66.25 billion in FY2024, with adjusted net income estimated to maintain a similar level as the previous year, resulting in an adjusted net income of $9.1 billion. This, combined with an anticipated annual GAAP EPS of $12.83 and a P/E ratio just under 16x, is anticipated to lead to a valuation of $205.
| Returns | Apr 2024 MTD [1] |
2024 YTD [1] |
2017-24 Total [2] |
| AXP Return | 0% | 21% | 207% |
| S&P 500 Return | 0% | 10% | 134% |
| Trefis Reinforced Value Portfolio | -1% | 6% | 649% |
[1] Returns as of 4/2/2024
[2] Cumulative total returns since the end of 2016
Invest with Trefis Market-Beating Portfolios
See all Trefis Price Estimates
The views and opinions expressed herein are the views and opinions of the author and do not necessarily reflect those of Nasdaq, Inc.