
Analysts See Promising Upside for iShares MSCI USA Min Vol ETF
At ETF Channel, we analyzed the underlying holdings of various ETFs within our coverage universe. By comparing the trading price of each holding to the average analyst’s 12-month forward target price, we calculated the weighted average implied analyst target price for the ETF itself. For the iShares MSCI USA Min Vol Factor ETF (Symbol: USMV), we determined that its implied analyst target price is $104.17 per unit.
Currently, with USMV trading around $93.82 per unit, this suggests that analysts project an 11.03% upside for the ETF based on the average analyst targets of its underlying holdings. Notably, three of USMV’s underlying holdings exhibit significant potential upside compared to their respective analyst target prices. These include Alnylam Pharmaceuticals Inc (Symbol: ALNY), Lilly (Eli) & Co (Symbol: LLY), and Keurig Dr Pepper Inc (Symbol: KDP). For instance, while ALNY recently traded at $244.52 per share, analysts predict a 26.40% increase, targeting an average price of $309.08 per share. Similarly, LLY’s current share price of $869.58 suggests a 17.08% upside to its average target price of $1,018.09 per share. Lastly, analysts expect KDP’s share price to rise 14.81% from its recent level of $33.34 to a target of $38.28.
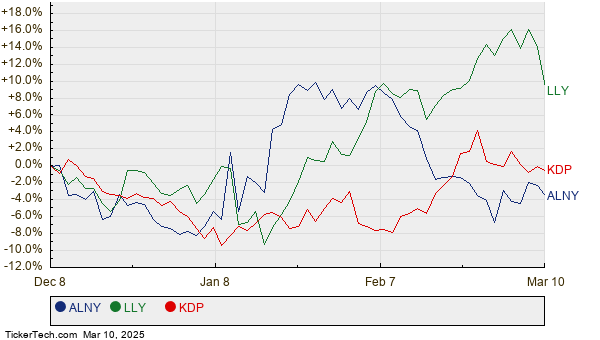
Below is a twelve-month price history chart comparing the stock performance of ALNY, LLY, and KDP:

Additionally, we present a summary table of the current analyst target prices for the discussed stocks:
| Name | Symbol | Recent Price | Avg. Analyst 12-Mo. Target | % Upside to Target |
|---|---|---|---|---|
| iShares MSCI USA Min Vol Factor ETF | USMV | $93.82 | $104.17 | 11.03% |
| Alnylam Pharmaceuticals Inc | ALNY | $244.52 | $309.08 | 26.40% |
| Lilly (Eli) & Co | LLY | $869.58 | $1,018.09 | 17.08% |
| Keurig Dr Pepper Inc | KDP | $33.34 | $38.28 | 14.81% |
The question remains: Are analysts justified in these targets, or are they overly optimistic about stock performance in the next year? Investors should consider whether analysts have a solid basis for their projections or if they may be out of touch with current company and industry developments. A high target price compared to a stock’s trading price can indicate optimism about future growth. However, it may also signal the potential for target price downgrades if those price points reflect outdated assumptions. Investors should conduct further research to form their own conclusions.
![]()
![]() 10 ETFs With Most Upside To Analyst Targets »
10 ETFs With Most Upside To Analyst Targets »
also see:
VVOS Videos
FCPT shares outstanding history
HYBB market cap history
The views and opinions expressed herein are those of the author and do not necessarily reflect those of Nasdaq, Inc.


