Vanguard Tax-Exempt Bond ETF Falls into Oversold Territory
Technical Indicators Signal Possible Buying Opportunity
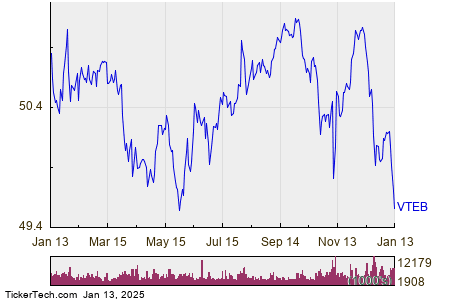
On Monday, shares of the Vanguard Tax-Exempt Bond ETF (Symbol: VTEB) fell into oversold territory, trading as low as $49.52 per share. Oversold territory is identified using the Relative Strength Index (RSI), a tool in technical analysis that measures momentum on a scale ranging from zero to 100. A stock is deemed oversold when its RSI score dips below 30.
For VTEB, the RSI recently hit 29.9. In comparison, the S&P 500 index registers a higher RSI of 39.2. Investors who adopt a bullish stance might interpret VTEB’s 29.9 reading as an indication that recent heavy selling could be slowing down, signaling potential buying opportunities.
Reviewing VTEB’s one-year performance, the ETF has seen its lowest price in the last 52 weeks at $49.52 per share, with the highest point reaching $51.17. Currently, the latest trade shows VTEB at $49.57, reflecting a slight drop of about 0.3% on the day.

Free Report: Top 8%+ Dividends (paid monthly)
![]() Discover 9 other oversold stocks worth watching »
Discover 9 other oversold stocks worth watching »
Additional Resources:
- Chase Coleman Stock Picks
- Top Ten Hedge Funds Holding TPIF
- Top Ten Hedge Funds Holding TRHC
The views and opinions expressed herein are those of the author and do not necessarily reflect those of Nasdaq, Inc.


