Vodafone Shares Slide Below 200-Day Moving Average
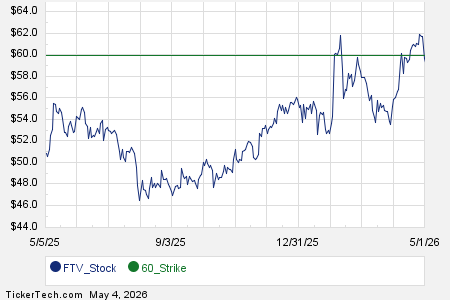
In trading on Monday, shares of Vodafone Group plc (Symbol: VOD) fell below their 200-day moving average of $9.17, reaching a low of $9.05 per share. Currently, Vodafone’s stock is down about 2.6% for the day. The chart below illustrates the one-year performance of VOD shares in relation to its 200-day moving average:

Vodafone’s 52-week trading range shows a low of $8 per share and a high of $10.39, with the last trade recorded at $9.06.
![]()
![]() Click here to find out which 9 other dividend stocks recently crossed below their 200-day moving average »
Click here to find out which 9 other dividend stocks recently crossed below their 200-day moving average »
Also see:
Top Ten Hedge Funds Holding VDNI
Top Ten Hedge Funds Holding XRAY
Extra Space Storage Average Annual Return
The views and opinions expressed herein are the views and opinions of the author and do not necessarily reflect those of Nasdaq, Inc.
5 Stocks Our Experts Predict Could Double In the Next Year
By submitting your email, you'll also get a free pivot & flow membership. A free daily market overview. You can unsubscribe at any time.