Walmart Stock Outpaces Peers Ahead of Quarterly Earnings Report
Walmart (WMT) shares have demonstrated strong performance this year, significantly outperforming broader market indexes and competitors like Target (TGT) and Amazon (AMZN). As the company prepares to release its quarterly results on Thursday, May 15th, market watchers are keen to see if Walmart can continue this upward trend. Following the last quarterly report on February 20th, Walmart shares declined, despite a series of generally positive earnings outcomes. Target will report its results on May 21st.
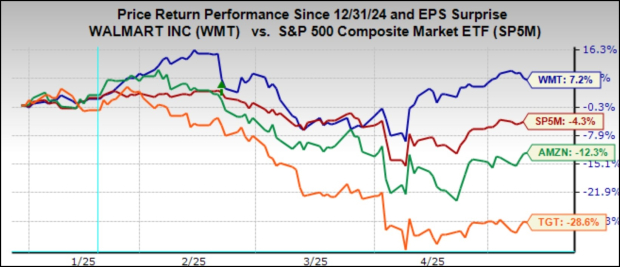
The year-to-date performance chart shows Walmart shares up +7.2%, contrasting with the S&P 500 index down -4.3%, Amazon down -12.3%, and Target down -28.6%:

Image Source: Zacks Investment Research
Walmart is set to kick off the Q1 reporting cycle for conventional retailers, with other companies following suit in subsequent weeks. The upcoming report is crucial as it will provide insights into the effects of the new tariff regime and broader trends in consumer spending. During the April 9th investor day event, management discussed some of these trends and acknowledged short-term tariff-related challenges.
Despite the current macro uncertainties, management remains optimistic about achieving long-term targets, committing to at least +4% sales growth and operating income growth exceeding sales growth. Over the past two years, Walmart has surpassed its goals, with sales increasing by +5.5% and operating income rising by +9.5%.
Two-thirds of Walmart’s U.S. sales come from domestically sourced products, providing some protection against tariff impacts compared to competitors. A significant contributor to this insulation is Walmart’s grocery business, which comprises nearly 60% of total sales, whereas grocery sales represent a smaller portion of Target’s revenue. Walmart also plans to maintain its price advantage over rivals, leveraging its scale, supplier relationships, and enhanced logistical automation. This value-oriented approach, along with an effective digital strategy, has been essential for gaining market share in groceries and attracting higher-income households.
In addition to grocery sales growth, Walmart’s expanding e-commerce operations are not just attracting affluent consumers. They also provide opportunities for higher-margin revenue sources, such as advertising and third-party fulfillment. Currently, e-commerce accounts for roughly 15% of total sales, with management expecting this figure to more than double in the long term.
Walmart is projected to report earnings per share (EPS) of $0.58 on revenues of $165.6 billion. These figures indicate year-over-year changes of -3.3% for EPS and +2.5% for revenue. This EPS estimate aligns with management’s earlier guidance of $0.57 to $0.58 per share, although it wasn’t reiterated during the April 9th event, and projections have slightly decreased as the quarter progressed.
Management has indicated a less favorable business mix for the most recent quarter, as the general merchandise sector experienced a weak start, although trends improved later on. A positive report for general merchandise could also positively impact Target. Same-store sales, excluding fuel, are expected to rise by +3.21% this quarter, down from +4.9% in the previous period, but higher than the expected +4.36%.
Regarding the Retail Sector 2025 Q1 Earnings Scorecard, results from 20 of the 33 retailers in the S&P 500 have been released. The Zacks Retail sector includes Walmart, Target, other traditional retailers, online vendors like Amazon, and restaurant chains.
So far, these 20 Zacks Retail companies have reported total Q1 earnings growth of +20.2% compared to the same period last year, with revenues up by +6.9%. Approximately 55% surpassed EPS estimates, while 45% exceeded revenue expectations.
Historical performance for these companies shows that the recent EPS and revenue beats are below historical averages:
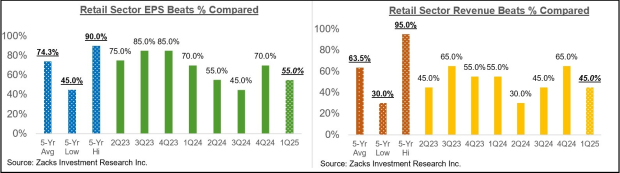
Image Source: Zacks Investment Research
While the overall earnings growth rate appears robust, removing Amazon from the analysis alters the picture. Amazon’s Q1 results showed a +42.6% EPS increase and +8.6% revenue growth, surpassing expectations.
The convergence of digital and physical retail continues. Amazon has established a significant brick-and-mortar presence with Whole Foods, while Walmart expands its online sales. Walmart’s growing digital initiatives are elevating its position in advertising, a trend accelerated during the COVID-19 pandemic.
The following charts illustrate Q1 earnings and revenue growth compared to prior periods, both including and excluding Amazon’s results:
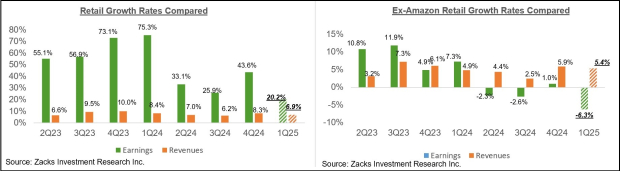
Image Source: Zacks Investment Research
The results excluding Amazon indicate earnings down -6.3% alongside a +5.4% increase in revenue, highlighting margin pressures within the sector.
Key Earnings Reports This Week
Over 500 companies are set to release their results this week, including 11 S&P 500 members. Alongside Walmart, notable companies reporting include Cisco Systems, Applied Materials, Deere & Company, and Alibaba.
The Q1 Earnings Scorecard
As of Friday, May 9th, Q1 results from 452 S&P 500 members, accounting for 90.4% of the index, show a total earnings increase of +12.2% from the previous year, supported by +4.4% revenue growth. A total of 73.7% of these companies exceeded EPS estimates, while 61.9% surpassed revenue projections.
The comparison charts below illustrate the Q1 earnings and revenue growth rates for these S&P 500 members in a historical context:
Current Earnings Trends: Insights from Q1 Reports and Future Estimates
The comparison charts below illustrate the Q1 EPS and revenue beats percentages in a historical context.
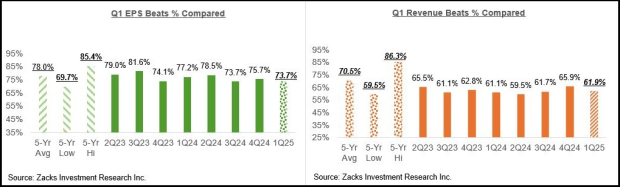
Image Source: Zacks Investment Research
Currently, EPS and revenue beats percentages are below historical averages. The Q1 EPS beats percentage stands at 73.7% for the companies that have reported, compared to the 20-quarter average of 78%. Meanwhile, the Q1 revenue beats percentage is at 61.9%, lower than the 5-year average of 70.5%.
Evaluating Q1 Earnings Growth Estimates
For Q1 as a whole, combining the actual results from the 452 S&P 500 members with expected results for those yet to report, earnings are projected to increase by 12.3% year-over-year, accompanied by a 4.5% rise in revenues. This follows a previous period of 14.1% earnings growth on a revenue increase of 5.7%.
The chart below displays current earnings and revenue growth expectations for Q1 2025, contextualized against the growth trends of the past four quarters and projected for the next three.
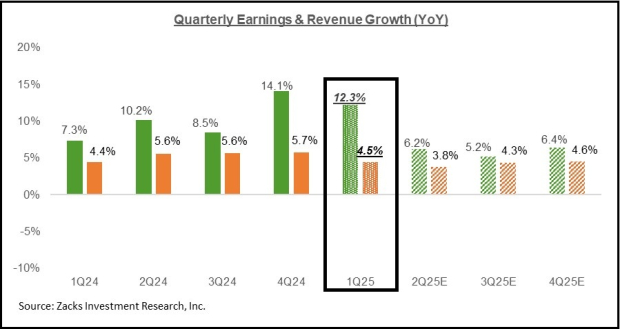
Image Source: Zacks Investment Research
In recent weeks, we have observed a decline in estimates for the current period (2025 Q2), with a negative revision trend expected to accelerate as companies release their results and discuss uncertainties impacting their near-term outlook.
The chart below illustrates how estimates for the current period have changed since the start of the year.
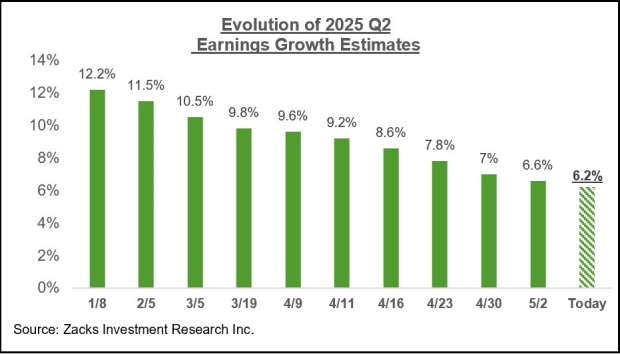
Image Source: Zacks Investment Research
The extent of cuts to 2025 Q2 estimates has been greater and more widespread compared to trends seen in the post-COVID period. However, an interesting trend has emerged within the Tech sector’s estimates, both for Q2 and the full year of 2025.
The chart below reveals a recent uptick in Tech sector earnings estimates, suggesting they may have bottomed out two weeks ago and are now on the rise.
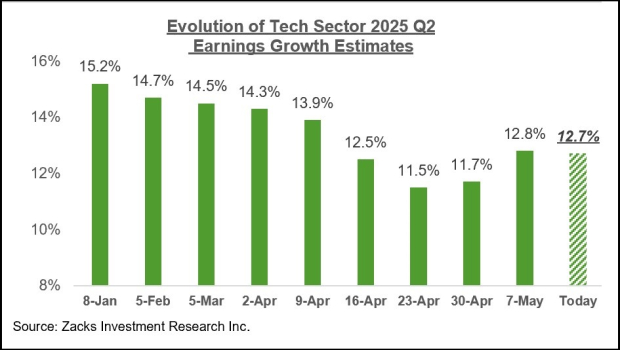
Image Source: Zacks Investment Research
This trend is also apparent in annual estimates, as shown in the chart below which illustrates evolving earnings expectations for the full year of 2025.
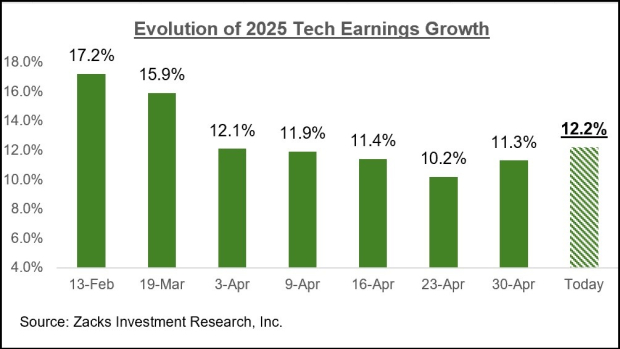
Image Source: Zacks Investment Research
Although the recent positive developments in estimate revisions are encouraging, caution is warranted. Analysts may have overreacted with past downward cuts after the April 2nd tariff announcements. Management’s comments during Q1 earnings calls may have led to a reassessment, contributing to this slight rise in estimates. If this trend continues for several weeks, it could signal that the earnings outlook is stabilizing and showing signs of improvement.
The chart below presents an overview of the earnings picture on a calendar-year basis.
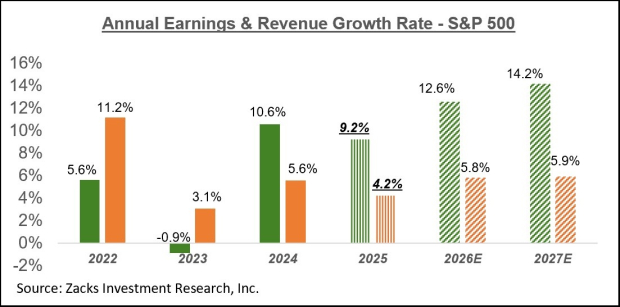
Image Source: Zacks Investment Research
Estimates for full-year 2025 have also faced challenges in recent weeks, as the negative revisions trend has intensified since mid-February 2025. However, upward revisions for Tech sector estimates are beginning to influence the overall yearly estimates, indicating a reversal in the previously negative trend, as shown in the chart below.
The chart below outlines how full-year 2025 earnings growth expectations have been shaped in recent weeks.
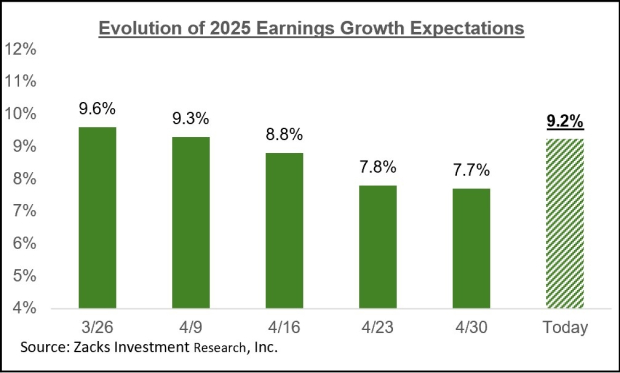
Image Source: Zacks Investment Research
For further information on the evolving earnings landscape, please refer to our weekly Earnings Trends report.