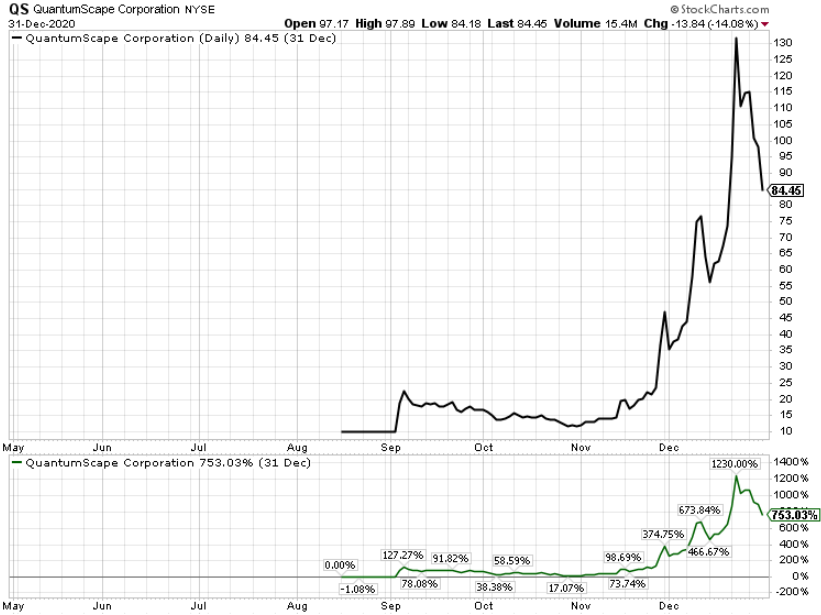
In trading on Wednesday, shares of WEC Energy Group Inc (Symbol: WEC) crossed below their 200 day moving average of $82.26, changing hands as low as $81.98 per share. WEC Energy Group Inc shares are currently trading off about 3% on the day. The chart below shows the one year performance of WEC shares, versus its 200 day moving average:

Looking at the chart above, WEC’s low point in its 52 week range is $75.126 per share, with $93.37 as the 52 week high point — that compares with a last trade of $82.00. The WEC DMA information above was sourced from TechnicalAnalysisChannel.com
![]()
![]() Click here to find out which 9 other energy stocks recently crossed below their 200 day moving average »
Click here to find out which 9 other energy stocks recently crossed below their 200 day moving average »
Also see:
NBST shares outstanding history
PGR Stock Predictions
NJR market cap history
The views and opinions expressed herein are the views and opinions of the author and do not necessarily reflect those of Nasdaq, Inc.