Consumer Products Stocks Struggle Amid Broader Market Trends
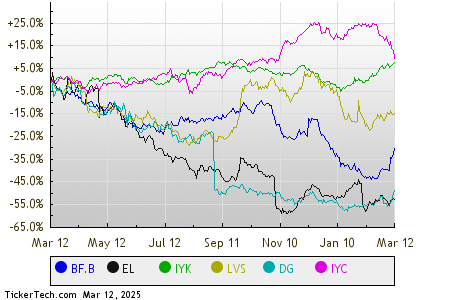
In afternoon trading on Wednesday, the Consumer Products sector is facing challenges, showing a 1.3% loss. Brown-Forman Corp (Symbol: BF.B) and Estee Lauder Cos., Inc. (Symbol: EL) are among the notable laggards within this group, with respective declines of 6.2% and 4.4%. For investors tracking this sector, the iShares U.S. Consumer Goods ETF (Symbol: IYK) reflects a downturn of 1.7% on the day but still shows a year-to-date increase of 6.30%. In contrast, Brown-Forman Corp is down 10.38% year-to-date, while Estee Lauder Cos. has seen a year-to-date decrease of 10.80%.
The Services sector follows closely, reporting a 1.2% loss as well. Within large Services stocks, Las Vegas Sands Corp (Symbol: LVS) and Dollar General Corp (Symbol: DG) lead the decline, with losses of 4.1% and 3.6%, respectively. The iShares U.S. Consumer Services ETF (IYC), which tracks the performance of these stocks, is currently up 0.1% during midday trading, yet reflects an overall decrease of 8.74% year-to-date. Year-to-date, Las Vegas Sands Corp has experienced a substantial drop of 15.82%, while Dollar General Corp shows a slight increase of 0.74%. Together, LVS and DG represent roughly 0.6% of IYC’s underlying holdings.
For a comparative analysis, the following is a relative stock price performance chart, illustrating the twelve-month performance of these stocks, with each symbol color-coded as indicated in the legend below:

Here is a snapshot of how the S&P 500 components across various sectors are performing in Wednesday’s afternoon trading. Notably, three sectors show gains, while six falter.
| Sector | % Change |
|---|---|
| Energy | +1.4% |
| Technology & Communications | +0.4% |
| Utilities | +0.1% |
| Financial | -0.1% |
| Industrial | -0.3% |
| Materials | -0.3% |
| Healthcare | -1.1% |
| Services | -1.2% |
| Consumer Products | -1.3% |
![]()
![]() 25 Dividend Giants Widely Held By ETFs »
25 Dividend Giants Widely Held By ETFs »
Also See:
• MKGI Insider Buying
• AMTB Market Cap History
• SFBC Market Cap History
The views and opinions expressed herein are the views and opinions of the author and do not necessarily reflect those of Nasdaq, Inc.
5 Stocks Our Experts Predict Could Double In the Next Year
By submitting your email, you'll also get a free pivot & flow membership. A free daily market overview. You can unsubscribe at any time.