CVS Health Earnings Report Set for May 1: Key Insights
CVS Health (NYSE:CVS) will release its earnings report on Thursday, May 1, 2025. Historically, the stock reaction to earnings announcements has been evenly split. Over the last five years, CVS stock has shown a positive one-day return in 50% of cases, yielding a median positive return of 4.6% and a maximum of 14.9%. In contrast, the remaining 50% resulted in a negative one-day return, with a median of -3.4% and a maximum drop of 16.8%.
Strategies for Event-Driven Traders
For event-driven traders, understanding these historical patterns can provide valuable insights. Traders may adopt one of two primary strategies: positioning themselves before the earnings release based on historical probabilities, or examining the relationship between immediate and medium-term returns post-announcement to inform their trading decisions.
Current Earnings Estimates
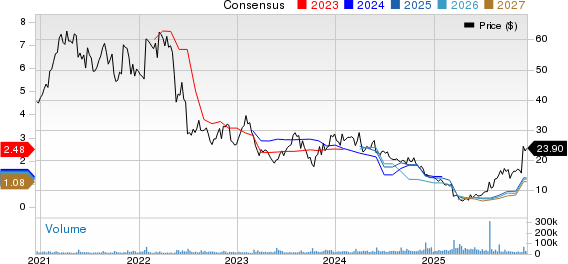
Consensus estimates project CVS’s earnings per share at $1.63 on revenues of $93.35 billion. This marks an improvement from the same quarter last year, which reported earnings of $1.31 per share on revenues of $88.44 billion. This anticipated revenue growth is likely driven by increased prescription volumes and drug price inflation. However, it is essential to note that rising medical costs may still pressure CVS’s financials.
Financial Overview
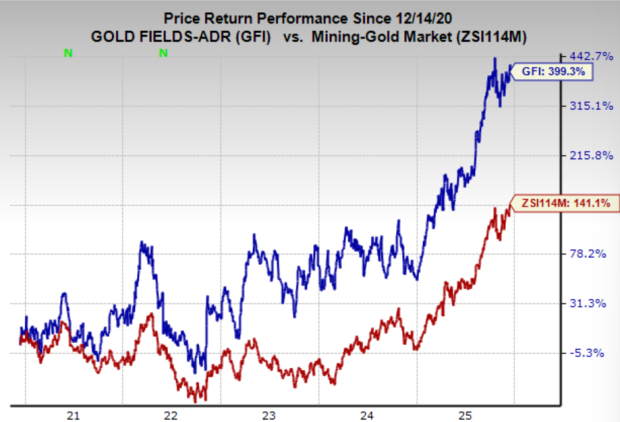
From a fundamental standpoint, CVS currently holds a market capitalization of $82 billion. Its revenue for the past twelve months reached $373 billion, leading to an operating profit of $9.8 billion and a net income of $4.6 billion.
Historical Odds of Positive Post-Earnings Return
Observations regarding one-day (1D) post-earnings returns include:
- Over the last five years, CVS recorded 20 earnings data points, with 10 positive and 10 negative one-day returns (50% positive).
- This percentage increases to 58% when assessing data from the last three years.
- The median of the 10 positive returns is 4.6%, while the median for negative returns is -3.4%.
Further insights into observed 5-Day (5D) and 21-Day (21D) returns post earnings are illustrated in the table below.
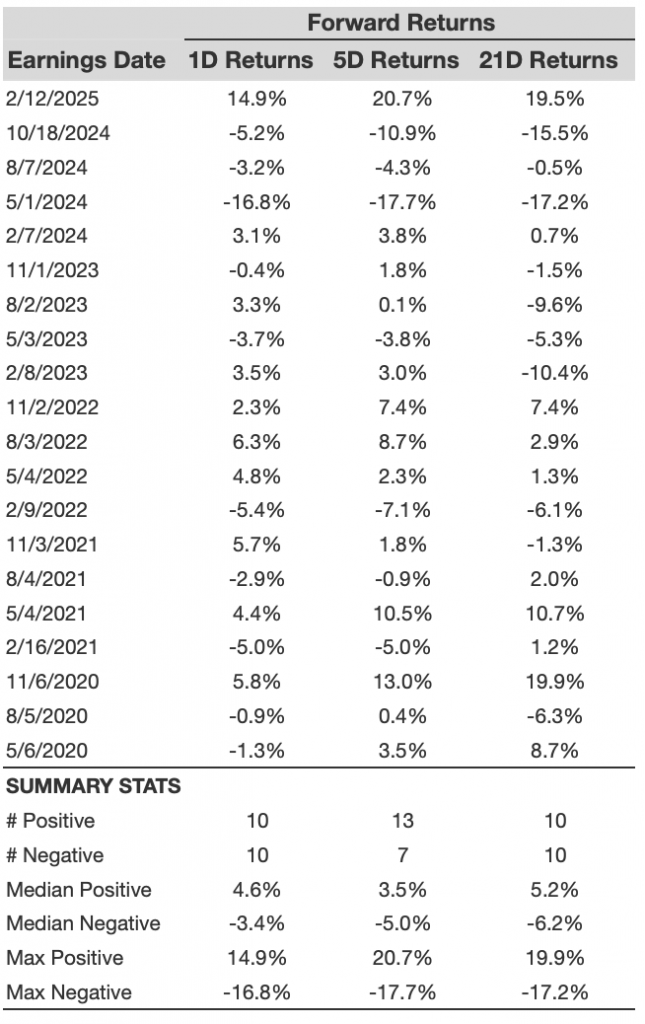
CVS 1D, 5D, and 21D Post earnings Return
Correlation Between Short- and Medium-Term Returns
A less risky strategy involves examining the correlation between short-term and medium-term returns after earnings. Traders may find pairs with the highest correlation and execute trades accordingly. For example, if 1D and 5D returns are positively correlated, a trader might choose a “long” position for the following 5 days if the 1D return post-earnings is positive. The correlation data below is drawn from both five-year and three-year historical periods.
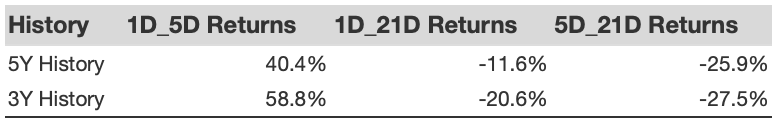
CVS Correlation Between 1D, 5D and 21D Historical Returns
Correlation with Peer Earnings
Performance of peers can also affect post-earnings stock reactions. Market pricing may start even before earnings are announced. The historical data below compares CVS Health’s post-earnings performance against peers that reported earnings prior to CVS Health.
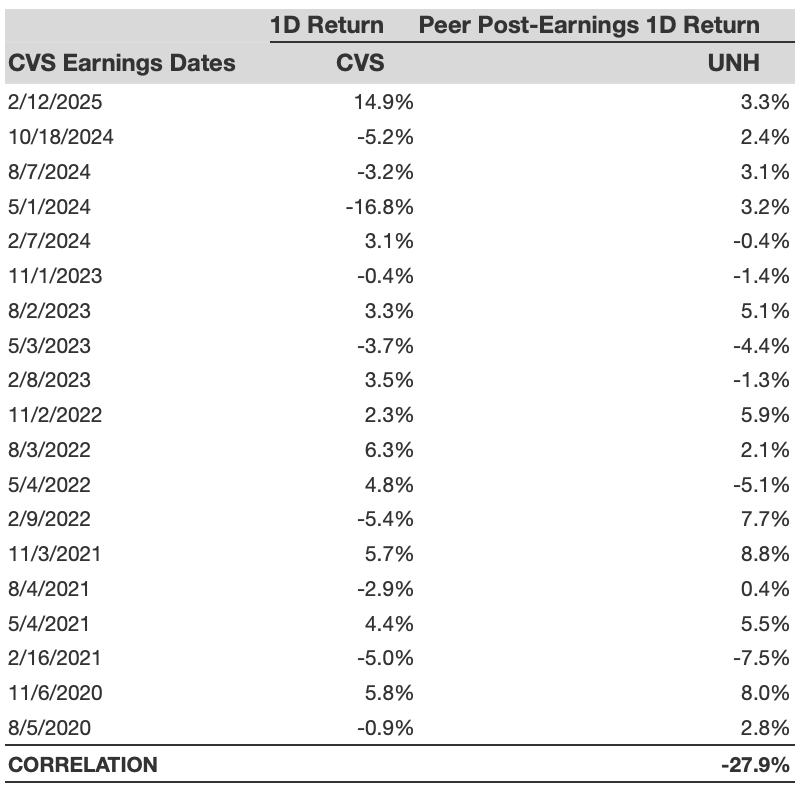
CVS Correlation With Peer earnings
The views and opinions expressed herein are those of the author and do not necessarily reflect the views of Nasdaq, Inc.