2023: A Pivotal Year for Nasdaq
As we step into 2024, the economic horizon, both global and close to home, displays a mix of challenges and opportunities. The Nasdaq, along with the Invesco QQQ Trust, takes center stage in this swiftly changing arena, embodying the innovative and technology-driven sectors driving our future.
2023 was a transformative year for the Nasdaq, not only due to geopolitical tensions impacting global trade but also because of breakthroughs in financial technology, accentuated by the rise of Bitcoin ETFs.
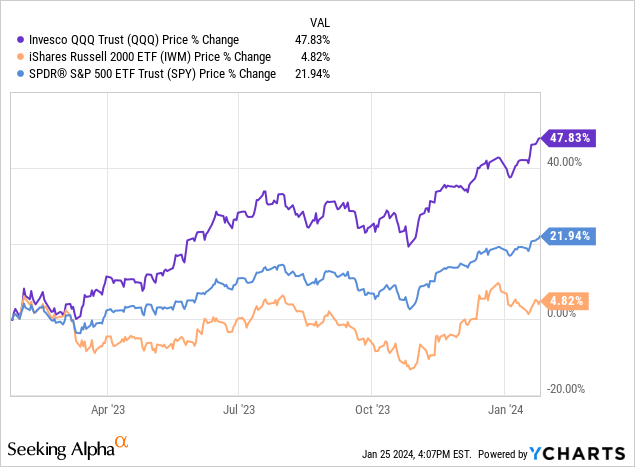
The vigorous performance of tech-heavy indices like the Nasdaq, often outperforming traditional benchmarks such as the S&P 500, reflects a market teeming with optimism yet rife with volatility. This article aims to dissect these multifaceted developments, analyzing essential economic indicators and policies relevant to all sectors, with a primary focus on Nasdaq and (NASDAQ:QQQ). As evidenced in the graph below, QQQ surged by nearly 48% over a 1-year period, leaving many to ponder whether there is still momentum to be capitalized upon.
We will explore the pivotal role of the Federal Reserve in guiding the U.S. economy amid inflationary challenges, highlighting its impact on the technology and growth sectors predominantly represented in the Nasdaq. Additionally, we will delve into the intricate interplay between the global bond, stock, and commodities markets, emphasizing how shifts in these areas impact the overall market. For investors and policymakers navigating this dynamic terrain, comprehending these factors becomes imperative in anticipating and adapting to the economic realities of 2024, particularly in the technology and innovation-driven markets central to the Nasdaq and QQQ.
The Battle Against Inflation
The Federal Reserve, commonly known as the Fed, plays a crucial role in managing US monetary policy by controlling the money supply and setting interest rates to promote maximum employment and price stability, maintaining long-term interest rates at around 2% to ensure economic stability. Moreover, the Fed plays a vital role in ensuring the stability of the financial system by supervising domestic and foreign banks operating in the U.S.
One of the Fed’s primary mandates is to manage inflation and employment levels, often utilizing tools like adjusting the federal funds rate to influence the economy.
Let’s focus on crucial indicators:
Consumer Price Index (CPI): This widely used indicator in macroeconomics reflects the cost of living by measuring changes in the price level of a consumer goods and services market basket. Fluctuations in the CPI over the past 24 months can be attributed to several factors, including supply chain disruptions and policy responses to the pandemic.
Recently, the Federal Reserve emphasized during their December 2023 meeting that they are closely watching multiple crucial signs as part of their effort to manage the delicate balance between aiding economic growth and keeping inflation in check, a task that both the market and the Fed are keenly focused on.
Personal Consumption Expenditures Price Index (PCE): This essential economic indicator measures the average changes in prices of goods and services consumed by U.S. households. The Core PCE Index, which provides a clearer view of underlying inflation trends by excluding volatile food and energy prices, is closely monitored by economic policymakers. The graph below shows the PCE on a relatively stern downtrend, heading for the Fed’s 2% target.
The Fed’s primary goal is to bring inflation back to their 2% target. While the labor market can greatly influence inflation, the Fed will be content with a strong labor market if inflation comes down, supporting its “soft landing” narrative.
Unemployment Rate: The Fed closely monitors the labor market through the unemployment rate and the degree of how tight the labor market has been. This has caused the market to re-evaluate the number of interest rate cuts in 2024.
Based on the PCE readings, it seems that inflation is coming down, referring to the strategic goal of cooling an overheated economy to tame high inflation without triggering a recession. The Fed is effectively trying to balance steady economic growth while avoiding the significant downturn that a more aggressive intervention might cause.
China’s Economic Challenges and Policy Outlook
The year ahead brings uncertainty for the Federal Reserve’s interest rate decisions, with potential changes looming on the horizon. Data suggests that a rate hike is unlikely, but the length of stability remains uncertain. Additionally, market expectations indicate the possibility of a rate cut in May, as analyzed by the CME Group’s FedWatch tool. It’s a waiting game with high stakes, as each economic data point could sway the Fed’s strategy dramatically.
The Dragon is Still Asleep
As 2024 unfolds, China’s economic landscape continues to surprise, defying predictions of a smooth recovery. The persistent challenges that plagued 2023 show no signs of dissipating anytime soon, painting a picture of a dragon still in slumber.
The pendulum of inflation and deflation swung back and forth in China’s economy over the past year. While moderate inflation marked the start of the year, a deflationary period gripped the nation from July onwards, driving prices downward due to subdued consumer demand, impactful policy decisions, and external economic pressures.
Though deflation may, at first glance, seem to enhance consumers’ purchasing ability, it carries the risk of dampening spending as people await further price drops. This, in turn, could hamper business revenues and impede economic expansion, casting a shadow of uncertainty over China’s economic outlook.
Impact on Policy and Future Outlook
These economic oscillations hold pivotal sway over China’s monetary and fiscal policies. With deflation looming, the government may seek to enact measures to spur expenditure and investment, attempting to tip the scales in favor of economic growth and stability.
Peering into the mist-shrouded future of 2024 and 2025, China’s economic forecast is a blend of guarded hopefulness and formidable hurdles. Financial pundits from J.P. Morgan Private Bank Asia and Morgan Stanley remain watchful, spotlighting the housing sector and local government finance as linchpins for the country’s post-pandemic recovery journey.
China’s economic landscape in the forthcoming years is projected to exhibit a sector-specific investment climate. Sectors buoyed by government patronage, such as consumer electronics, autos, batteries, renewables, and electric vehicles, are poised for resolute expansion, in line with the state’s thrust towards high-value manufacturing and eco-friendly technology as part of the “Common Prosperity” initiative.
Nevertheless, the consumer sector may not serve as an influential economic prop, given diminishing property prices and sluggish growth in household disposable income. Furthermore, an evolving economic model and demographic dynamics, including an aging populace, cloud long-term growth prospects, reshaping China’s economic fabric in subtle but critical ways.
For investors eyeing China in 2024, vigilance in two crucial arenas is paramount:
– Stimulus Considerations: The once-vibrant image of China as a galloping market has been recalibrated in the wake of geopolitical uncertainties. The country’s anemic rebound post-COVID-19 control relaxations in late 2022, coupled with real estate woes and export declines, took center stage in 2023. Citi analysts underscore the need for substantial policy intervention to rekindle growth, envisaging a modest GDP increment of around 4.6%.
– Opportunities Amidst Challenges: Beijing’s strategic pivot to diminish the property sector’s GDP contribution raises pertinent queries about fresh growth engines. Sectors such as machinery, electronics, and transport equipment emerge as plausible counterweights to the real estate ebb. Yet, transitioning to these novel economic stimulants entails deftly navigating labor market dynamics and supply chain recalibrations.
Financial Markets and Their Relationship to Tech Stocks, Bonds, and Commodities in 2024
China’s economic outlook for 2024 and 2025 is moderate growth owing to various challenges, including financial stability needs, geopolitical risks, and the impacts of evolving domestic policies and global market dynamics. While specific sectors and potential earnings growth offer optimism, the broader picture demands a cautious and well-informed approach from investors.
Bond Market Insights
The dynamics of the bond and stock markets have historically been intertwined through investor expectations and economic trends, reflecting a pattern akin to the 1980s and late 1990s as seen below.
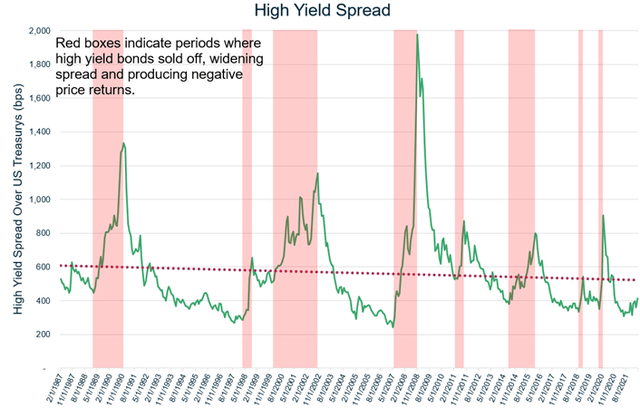
The current U.S. fixed income market trajectory, particularly after a historic selloff leading to a renewed optimism for bonds in 2024, echoes the 1980s when declining inflation propelled bond prices upwards. The fourth-quarter rally of 2023 pulled bonds back from a potential third consecutive annual loss, showcasing the cyclical nature of these markets.
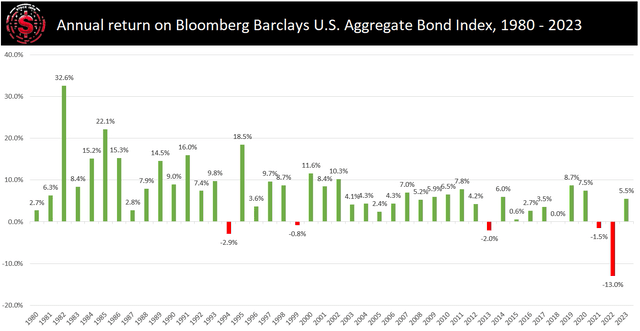
Investors currently hold their most substantial overweight position in bonds since 2009, mirroring past trends where falling inflation and lower Treasury yields fostered a favorable bond market environment. The journey to lower yields is expected to be turbulent, marked by concerns over anticipated rate cuts and market volatility if the Fed’s actions don’t align with expectations.
The evolving yield curve, slowly re-inverting, serves as a critical indicator, often signaling economic downturns while only sometimes correlating with immediate stock market impacts. A closer look at the bond yield curve since October reveals significant changes, suggesting the market still anticipates near-term risks but is gradually shifting towards a more normalized yield curve, echoing historical patterns from the 1980s.
Tech Stocks and Equities
Potential beneficiaries in the global tech cycle’s upturn are high-end manufacturing companies, and as the Chinese economy hopefully begins to bounce back, the expectation is for the Hang Seng Index to follow suit. With potential rate cuts, the re-valuation of equities and tech stocks within the Nasdaq becomes especially sensitive to interest rate changes.
Insights into Commodities Market
Commodities like gold, copper, and oil are a crucial part of the financial market, with their prices often reflecting broader economic sentiments and policies.
Gold:
Gold, a traditional safe-haven asset, often sees its price rise during economic uncertainty or inflation, reflecting its role as a stable store of value. As of early January 2024, gold stands at approximately $2,045.63/oz. Analysts forecast an average price of $1,986.50 for the year, with potential peaks possibly reaching up to $2,300 and even targeting $2,500, mainly if the Federal Reserve proceeds with rate cuts. Overall, gold ETFs saw a significant outflow in December 2023, possibly suggesting a shift towards risk assets over safe havens.
The Current Economic Landscape and Technical Market Analysis
Interpreting the Message in Copper, Oil, and Gold Prices
Copper prices, known for mirroring economic health, are indicating a potential uptick in global production through 2024. The metal, often associated with industrial growth, sees price fluctuations based on expectations of economic expansion and demand. As of January 5, 2024, copper is priced at approximately $8,463/t, with an average forecast for the year at around $8,800/t, powered by weakening US dollar strength and supply constraints. This hints at growing economic strength, a good sign for investors.
As a significant barometer for the global economic health, oil prices, currently trading around the forecasted average of $75 for 2024, are heavily influenced by geopolitical events, supply-demand dynamics, and OPEC policies. Major U.S. banks have predicted a median Brent price of $85 for 2024. This complexity in forecasting oil prices underscores their sensitivity to global economic shifts and policy changes.
Gold, copper, and oil, often intertwined with broader economic trends, offer essential insights into the market landscape and future directions. The ongoing decrease in safe-haven demand, coupled with projected productivity expansion, suggests a positive outlook, even as oil demand remains weak.
Deciphering Technical Market Indicators
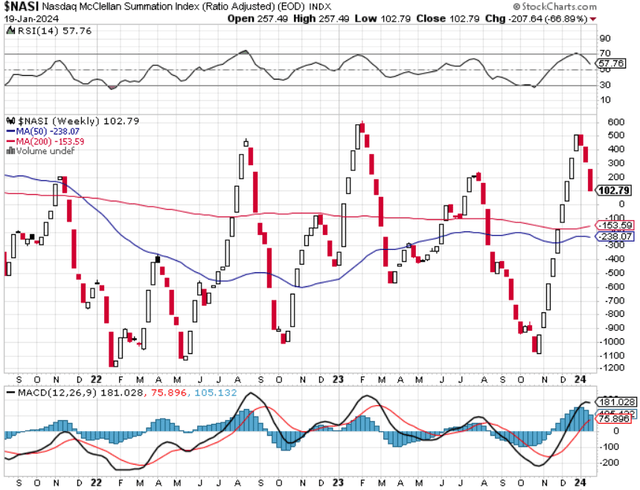
As we dig deeper into the macroeconomic environment, the technical standpoint of the market becomes pivotal for a comprehensive understanding of the current state. The $NASI index, a critical market breadth indicator, has been in a declining trend over the past three weeks, despite the Nasdaq’s ascent. This divergence between the two indicates potential signals in market analysis, such as breadth weakness, potential reversal hints, and sector rotation.
Shifting the focus to shorter-term momentum trends, the $NAMO, or Nasdaq McClellan Oscillator, a key market breadth indicator reflecting a change in market sentiment, presents an intriguing trend. Showing a significant surge from -63 to -35 in a matter of days, accompanied by the fast-moving average trending to cross the slow-moving average in an upward direction, this paints a picture of potential upward momentum.
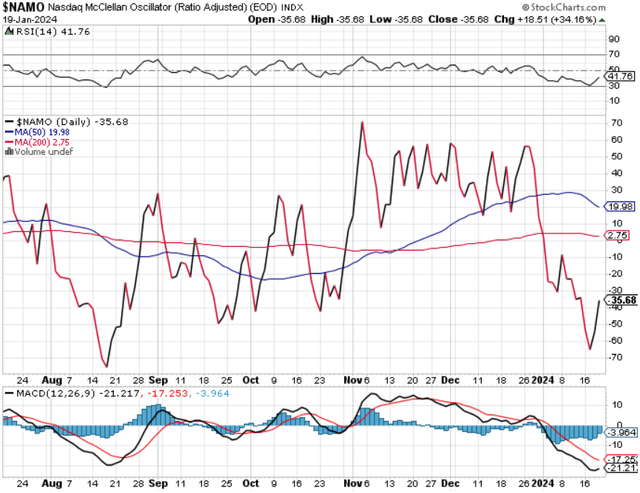
This sudden shift in momentum, complemented by the RSI bouncing off the 30-level, signals a possible upward trajectory, reinforcing the need for a vigilant approach to market risk assessment.
Interpreting The Nasdaq Composite and Market Sentiment for Potential Stock Movement
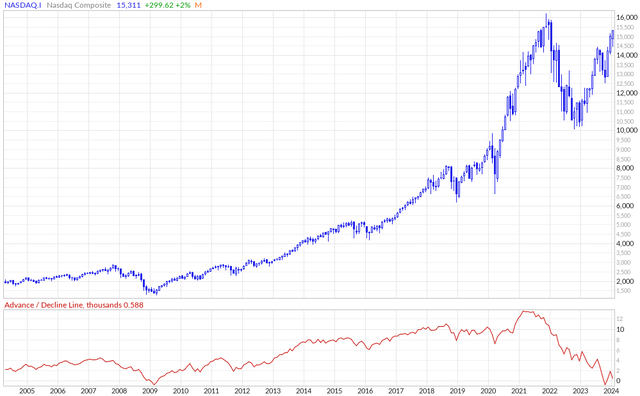
The advance/decline (AD) indicator is a powerful measure of market breadth, delineating the number of stocks contributing to a rise or fall in the overall index. Observing the Nasdaq composite alongside the AD-line reveals a conspicuous divergence, marking the rally at the outset of 2023 as primarily driven by relatively minor stocks. Strikingly, amidst the rapid ascent, the number of declining stocks grew in contrast to those advancing. This dichotomy underscores the extent to which a select few, rather than a varied cohort of stocks, are bolstering the Nasdaq composite. The index is thus being buoyed by a handful of prominent companies, rather than a cohesive and diverse spectrum of stocks.
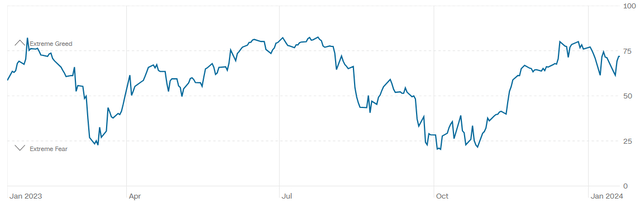
Our subsequent objective is to ascertain market sentiment and breadth through CNN’s fear and greed index, depicted in the timeline below. A key observation is the swift ascent of the index from the November lows, presently oscillating between greed and extreme greed. While not a definitive metric, this insight, when aggregated with other indicators, can provide valuable context.
Noteworthy is the habitual tendency of the fear and greed index to linger within the extreme greed territory during robust market uptrends, hinting at a potential reiteration of this pattern.
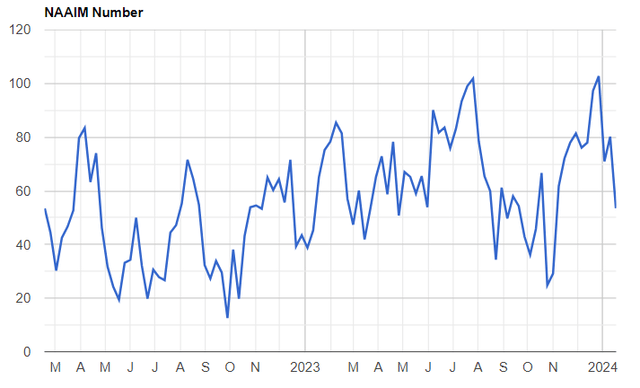
Concluding our analysis, we punctuate the discourse with the NAAIM number, a gauge of how active fund managers have adjusted their clients’ accounts on a biweekly basis. The most recent reading, dated January 17th, delineates a pronounced plunge, nearing the levels observed in May 2023. During a pronounced ascent, such a sharp decline in levels could signify an impending scope for further upward momentum.
Reflecting on the technical intricacies, let’s take a moment to distill the essence of our observations. The market has sustained a robust uptrend over recent months, and while it currently appears stretched, there remains untapped potential for further ascension.
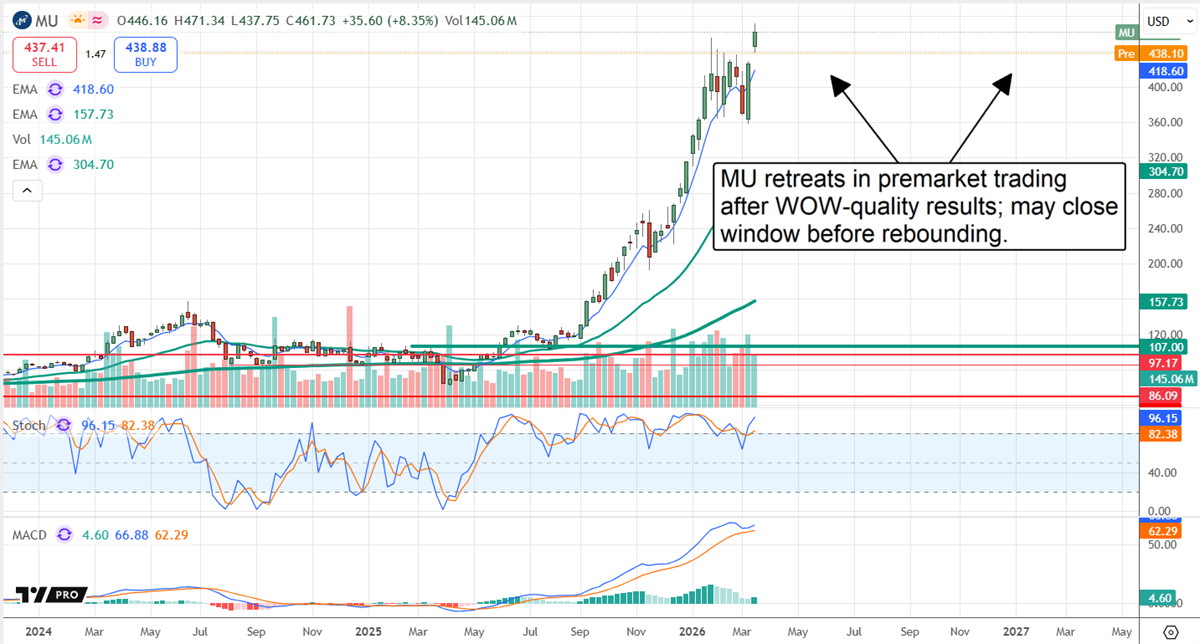
The AD-line substantiates that the surge can be attributed to a limited cluster of stocks, with a greater number experiencing declines than advances. But what transpires when these lagging stocks regain momentum? Our contention suggests the propensity to propel the QQQ near the 440 level.
Moreover, the $NAMO intimates the potential for an upswing in Nasdaq’s short-term momentum. It behooves investors to hearken to indicators like $NAMO and $NASI, repositories of rich data encapsulated in succinct metrics.
Contextualizing 2024: Navigating Dynamic Economic Terrain
Embarking upon 2024, the global economic milieu is ensconced within a tapestry of unfolding challenges and emergent opportunities. The Federal Reserve’s astute management of monetary policy amidst variable inflation rates, alongside China’s dynamic economic tides, exerts pivotal influence upon global economic patterns. Correspondingly, the bond and stock markets mirror these macroeconomic currents, unfurling a cautiously sanguine yet intricate outlook.
Furthermore, the commodities market, with its nuanced responsiveness to global dynamics, stands as a key barometer of overarching economic well-being. As these multifaceted constituents converge, 2024 delineates a realm of optimistic vigilance, underscoring the imperativeness of discernment and adaptability in investment and policy stratagems. Amidst this ever-evolving economic symphony, discerning acumen and strategic agility loom consequential in navigating potential headwinds and capitalizing upon nascent opportunities.