ArcelorMittal Stock Surges Nearly 50%; What’s Driving Its Gains?
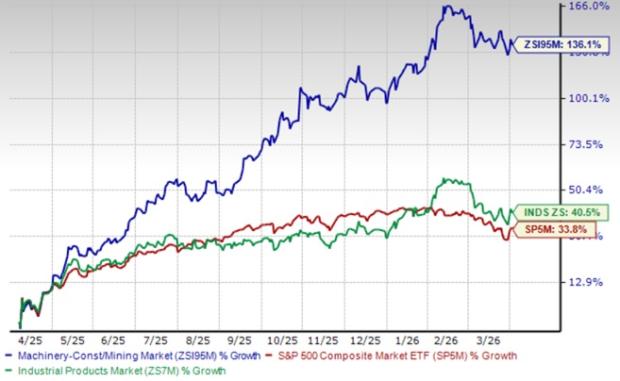
ArcelorMittal (NYSE:MT) has experienced an impressive stock price increase of nearly 50% over the past six months, significantly outpacing the S&P 500 Index which gained only 5%. This performance starkly contrasts with rivals such as VALE (NYSE: VALE), which fell by 4%, Cleveland-Cliffs (NYSE:CLF) down 11%, United States Steel Corporation (NYSE:X) up 13%, and Nucor Corp (NYSE: NUE) decreasing by 6% in the same timeframe. The primary driver behind ArcelorMittal’s stock rise is its stronger-than-anticipated earnings report for Q4 2024, where the company posted adjusted earnings of $0.52 per share and revenue of $14.71 billion.
Even though revenue fell by 3% in Q4 compared to the previous quarter, investors received the earnings report positively. The market views ArcelorMittal’s ongoing decarbonization efforts as a crucial long-term value driver. Furthermore, the company maintains a positive outlook for global steel demand outside of China, projecting growth between 2.5% and 3.5% for 2025. According to our analysis, we value MT Stock at approximately $30 per share, which is about 10% lower than its current market price. It is worth noting that the stock is trading at levels similar to those from late 2022. For those seeking a more stable investment than individual Stocks, the High Quality Portfolio may be of interest, having outperformed the S&P with returns exceeding 91% since its inception.

Image by Abel Sanchez from Pixabay
Factors Behind ArcelorMittal’s Stock Performance
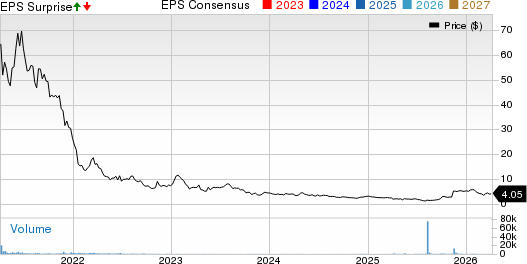
Part of the stock’s rise over the last six months aligns with the company’s nearly 55% growth in earnings per share, improving from $1.10 in 2023 to $1.70 in 2024. While revenue spiked in 2021 and 2022, it plateaued in 2023 and 2024 due to declining steel prices.
In recent years, ArcelorMittal has faced uneven revenue growth; however, its price-to-sales (P/S) multiple has seen an upward trend. The company’s P/S multiple increased from 0.27 in 2020 to 0.34 in 2023. Currently, it sits at 0.44, but this represents a potential downside compared to historical levels of 0.38 at the end of 2021 and 0.27 by the close of 2022.
Over the last four years, MT Stock has delivered inconsistent returns, often more volatile than the S&P 500. Specifically, returns were 40% in 2021, -16% in 2022, 10% in 2023, and -17% in 2024. In contrast, the Trefis High Quality (HQ) Portfolio, which comprises 30 stocks, has shown significantly lower volatility and has comfortably surpassed S&P 500 performance over the same period. Given the current uncertain macroeconomic conditions, including discussions of rate cuts and geopolitical conflicts, it remains to be seen whether MT will replicate its past underperformance or experience a resurgence in the coming year.
Projecting Future Performance of ArcelorMittal Stock
ArcelorMittal demonstrates recent robust performance, fueled by an optimistic outlook for steel demand in 2025. In Q4, the company reported an EBITDA of $1.65 billion. Although full-year operating profit declined from $8.74 billion in 2023 to $7.05 billion in 2024, EBITDA per tonne continues to exceed pre-COVID figures despite ongoing economic challenges. The firm anticipates an increase in global steel consumption outside China of 2.5% to 3.5% in 2025, backed by restocking and heightened demand. Capital expenditures are expected to remain in the range of $4.5 billion to $5 billion, with significant focuses on investments in Brazil, India, and the United States. Moreover, the company plans to allocate at least 50% of its post-dividend free cash flow to shareholders through share buybacks. For more insights, see our comprehensive analysis on ArcelorMittal Valuation: Is MT Stock Expensive Or Cheap? and check out our review of ArcelorMittal revenues for further details on its key income streams and future trends.
| Returns | Mar 2025 MTD [1] |
2025 YTD [1] |
2017-25 Total [2] |
| MT Return | 22% | 47% | 67% |
| S&P 500 Return | -4% | -2% | 156% |
| Trefis Reinforced Value Portfolio | -2% | -4% | 659% |
[1] Returns as of 3/7/2025
[2] Cumulative total returns since the end of 2016
Invest with Trefis Market-Beating Portfolios
see all Trefis Price Estimates
The views and opinions expressed herein are the views and opinions of the author and do not necessarily reflect those of Nasdaq, Inc.