Electronic Arts (NYSE: EA) recently reported its Q4 fiscal 2024 results (fiscal ends in March), with revenues and earnings falling below the street estimates. The company reported net bookings of $1.67 billion and adjusted earnings of $1.37 per share, compared to the consensus estimates of $1.78 billion and $1.52, respectively. This can be attributed to a broader decline in gaming demand, partly due to fewer releases. Looking at EA stock, we think it has some room for growth from its current levels of $125. In this note, we discuss Electronic Arts’ stock performance, key takeaways from its recent results, and valuation.
Firstly, let us look at Electronic Arts’ stock performance. EA stock has seen a decline of 15% from levels of $145 in early January 2021 to around $125 now, vs. an increase of about 40% for the S&P 500 over this roughly three-year period. However, the decrease in EA stock has been far from consistent. Returns for the stock were -8% in 2021, -7% in 2022, and 12% in 2023. In comparison, returns for the S&P 500 have been 27% in 2021, -19% in 2022, and 24% in 2023 — indicating that EA underperformed the S&P in 2021 and 2023.
In fact, consistently beating the S&P 500 — in good times and bad — has been difficult over recent years for individual stocks; for heavyweights in the Communication Services sector including GOOG, META, and NFLX, and even for the megacap stars TSLA, MSFT, and AMZN. In contrast, the Trefis High Quality (HQ) Portfolio, with a collection of 30 stocks, has outperformed the S&P 500 each year over the same period. Why is that? As a group, HQ Portfolio stocks provided better returns with less risk versus the benchmark index; less of a roller-coaster ride, as evident in HQ Portfolio performance metrics.
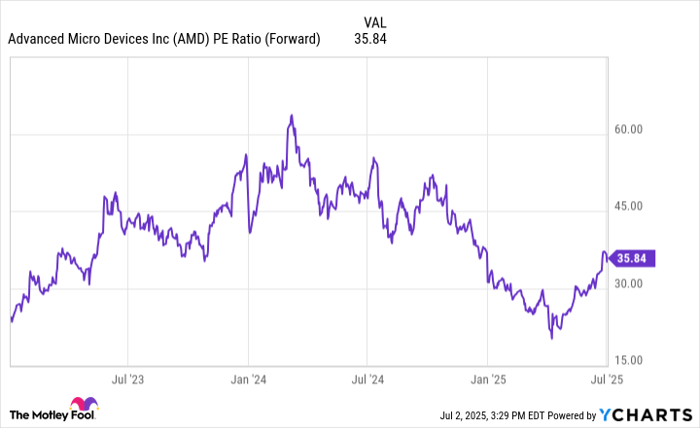
Given the current uncertain macroeconomic environment with high oil prices and elevated interest rates, could EA face a similar situation as it did in 2021 and 2023 and underperform the S&P over the next 12 months — or will it see a recovery? From a valuation perspective, EA stock looks like it has some room for growth. We estimate Electronic Arts’ Valuation to be $143 per share, reflecting around 15% upside from its current price of $125. Our forecast is based on a little under 19x P/E multiple for EA and expected earnings of $7.66 on a per-share and adjusted basis for the full fiscal 2025. The 19x figure aligns with the stock’s average P/E ratio over the last four years.
Electronic Arts’ revenue of $1.8 billion (GAAP) in Q4 was down 5% y-o-y. This can partly be attributed to a tough comparison with the prior-year quarter. More importantly, there has been a decline in the overall time spent on gaming, with the average quarterly playtime falling a significant 26% between 2021 and 2023. Electronic Arts saw its operating margin expand by 390 bps to 13.2% in Q4. Its adjusted profit of $370 million or $1.37 per share in Q4’24, reflected a 24% decline from its $487 million or $1.78 per-share profit figure in the prior-year quarter.
Not only did Electronic Arts post a downbeat Q4, its outlook for fiscal 2025 was softer than anticipated. The company expects its bookings to be in the range of $7.3 billion and $7.7 billion and adjusted earnings to be in the range of $7.05 and $7.85 per share in fiscal 2025. This compares with $7.4 billion in bookings and $6.92 adjusted earnings per share it reported in fiscal 2024. Although Electronic Arts will face near-term headwinds from a declining gaming demand, we think it is already priced in the stock.
While EA stock looks like it has some room for growth, it is helpful to see how Electronic Arts’ Peers fare on metrics that matter. You will find other valuable comparisons for companies across industries at Peer Comparisons.
| Returns | May 2024 MTD [1] |
2024 YTD [1] |
2017-24 Total [2] |
| EA Return | -1% | -8% | 59% |
| S&P 500 Return | 3% | 9% | 132% |
| Trefis Reinforced Value Portfolio | 4% | 4% | 636% |
[1] Returns as of 5/8/2024
[2] Cumulative total returns since the end of 2016
Invest with Trefis Market-Beating Portfolios
See all Trefis Price Estimates
The views and opinions expressed herein are the views and opinions of the author and do not necessarily reflect those of Nasdaq, Inc.


