Tesla (TSLA) Shows Signs of Reversal Despite Recent Downturn
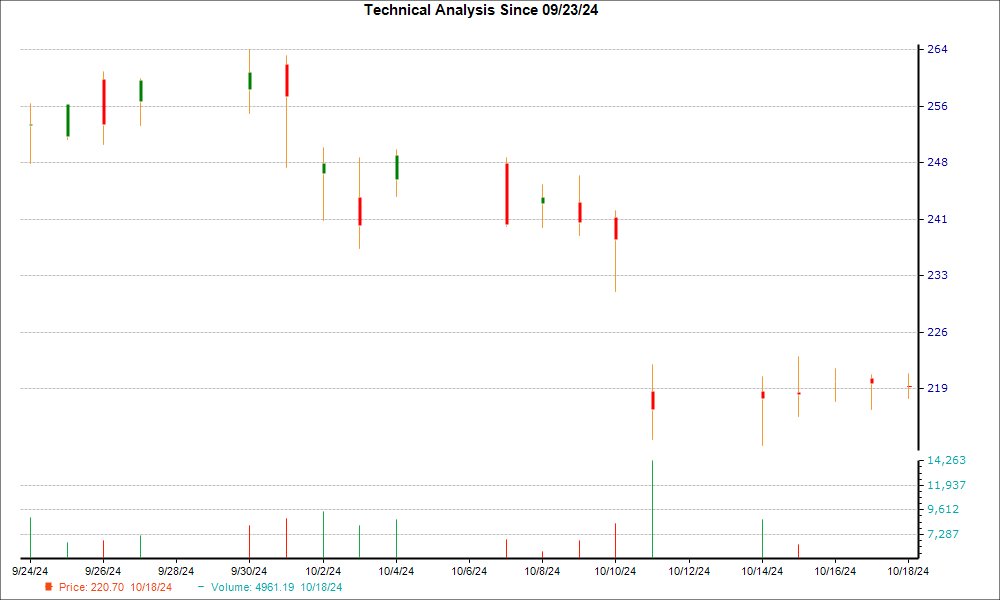
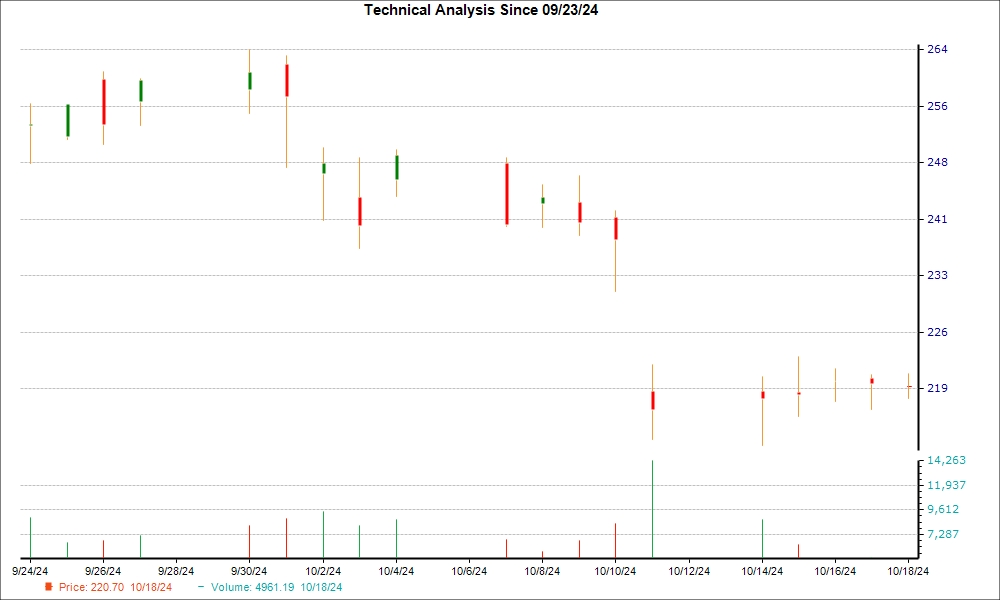
Tesla (TSLA) has faced a challenging two weeks, with its stock dropping 10.9%. However, recent trading activity has raised hopes for a reversal as a hammer chart pattern emerged in the last session. This pattern suggests that bullish investors may be regaining strength, providing potential support for the stock.
The hammer pattern, a technical tool often seen as a sign of a market bottom, indicates a reduction in selling pressure. Combined with a solid consensus among Wall Street analysts raising earnings estimates for Tesla, the outlook for a rebound appears promising.

Understanding the Hammer Chart Pattern
The hammer chart is a widely recognized formation in candlestick analysis. It features a small body formed by a minor difference between opening and closing prices, coupled with a long lower wick, indicating a greater difference between the day’s low and the open or close. The significant length of the wick compared to the body gives it the resemblance of a hammer.
Typically, during a downtrend, bears dominate the market, which leads to a lower opening and closing price compared to the previous day. On the day a hammer forms, the stock reaches a new low, but eventually finds some buying interest that pushes the price back up, closing near its opening price.
When this pattern appears at the end of a downtrend, it signals that the bears may be losing control. This shift opens the possibility for a trend upward, as buyers step in to halt further declines.
Hammer candles can be found across various timeframes—from one minute to daily and weekly charts—making them useful for both short-term traders and long-term investors.
Despite its significance, the hammer pattern has its limitations. Its effectiveness varies depending on its placement in the chart, so it should always be analyzed alongside other bullish signals.
Factors Supporting a TSLA Reversal
Recent improvements in earnings estimate revisions for Tesla are a positive sign on the fundamental side. Research shows a strong link between these revisions and short-term stock price changes.
Over the past month, the consensus earnings per share (EPS) estimate for Tesla has risen by 0.6%. This reflects a general agreement among analysts that the company may exceed its previous earnings predictions.
Additionally, Tesla holds a Zacks Rank of #2 (Buy), placing it within the top 20% of over 4,000 stocks analyzed based on earnings estimate trends and EPS surprises. Historically, such rankings indicate potential for better-than-average market performance. Stocks rated #1 or #2 typically outperform their counterparts.
The Zacks Rank serves as an effective timing indicator, assisting investors in spotting when a company’s outlook begins to improve. For Tesla, this Zacks Rank of #2 signals a solid fundamental backing for a possible turnaround.
Zacks’ Chief Names Potential “Stock Most Likely to Double”
Our research team has identified five stocks with the highest potential to gain over 100% in the near future. Among them, Director of Research Sheraz Mian has spotlighted one stock expected to deliver substantial returns.
This standout is part of a rapidly expanding financial firm with over 50 million customers, known for its innovative solutions. While not every recommendation from Zacks results in gains, this particular stock could outperform previous top picks, such as Nano-X Imaging, which surged by 129.6% in just nine months.
To explore our top stock choice and the four others, feel free to access our report.
Tesla, Inc. (TSLA): Access our Free Stock Analysis Report.
To view this article on Zacks.com, click here.
Zacks Investment Research
The views and opinions expressed herein are the views and opinions of the author and do not necessarily reflect those of Nasdaq, Inc.


