

Amazon Set to Announce Earnings with Historical Trends in Focus
Amazon.com (NASDAQ:AMZN) is set to publish its earnings report on Thursday, May 1, 2025. For traders focused on event-driven opportunities, analyzing the historical reactions of stock prices to earnings reports yields valuable insights. Over the past five years, AMZN has posted negative one-day returns following 60% of its earnings announcements. The median decrease during these periods was -6.1%, with the most substantial drop reaching -14%.
Strategies for Traders Based on Historical Data
Traders can utilize these historical trends in two main ways. Firstly, they can evaluate the historical odds and establish a position in AMZN Stock before the earnings announcement. Secondly, they can assess the correlation between immediate stock reactions post-earnings and medium-term performance, enabling informed post-earnings strategies.
Current Earnings Estimates
This quarter, forecasts indicate Amazon will report earnings of $1.36 per share, with revenue projected at $155.1 billion. This marks a considerable increase from the same quarter last year when it recorded earnings of $0.98 per share and sales of $143.3 billion. The cloud computing segment, Amazon Web Services (AWS), is expected to significantly contribute to this revenue growth. However, the company anticipates around $2 billion in negative impacts due to foreign currency fluctuations during the quarter.
Amazon’s Financial Overview
Fundamentally, Amazon’s market capitalization stands at $2.0 trillion, with trailing twelve-month revenue of $638 billion. The company has exhibited operational profitability, showcasing $69 billion in operating profits and a net income of $59 billion.
Examining Post-Earnings Returns
Analyzing past one-day post-earnings returns yields interesting observations:
- In the last five years, 20 earnings data points show 8 positive and 12 negative one-day returns, indicating a 40% rate of positive returns.
- This figure improves to 55% when considering data solely from the past three years.
- The median of the 8 positive returns is 7.3%, while the median of the 12 negative returns is -6.1%.
The accompanying table provides additional data on 5-day (5D) and 21-day (21D) returns following earnings.

AMZN 1D, 5D, and 21D Post earnings Return
Analyzing Correlations in Post-Earnings Returns
Understanding the correlation between short-term and medium-term returns can develop a less risky strategy, provided correlations are strong. For instance, if one-day (1D) and 5-day (5D) returns exhibit the highest correlation, traders can take a long position for the next five days after a positive one-day post-earnings return. The following correlation data highlights these relationships based on both five-year and more recent three-year history.
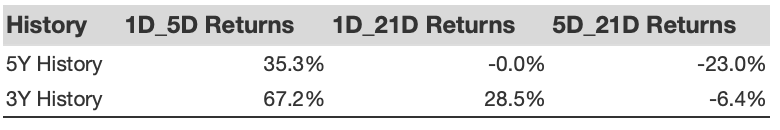
AMZN Correlation Between 1D, 5D and 21D Historical Returns
The views and opinions expressed herein are the views and opinions of the author and do not necessarily reflect those of Nasdaq, Inc.


