Deckers Outdoor Corp Set to Announce Q4 Earnings on May 22
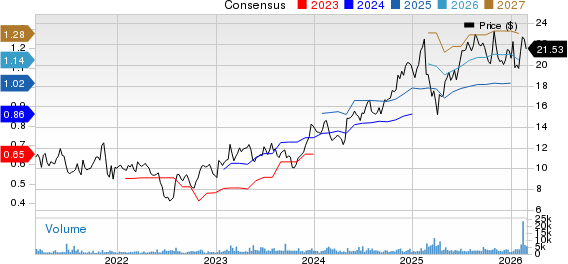
Deckers Outdoor Corp (NYSE: DECK) will report its fiscal fourth-quarter earnings on Thursday, May 22, 2025. Analysts expect earnings of 60 cents per share with revenue estimates at $1 billion. This represents a 28% decline in year-over-year earnings and a 4% increase in sales from the previous year’s earnings of 83 cents per share and revenue of $960 million. Historically, DECK stock has shown a 61% increase in value after earnings announcements, with an average one-day rise of 9.0% and a peak increase of 19%.
Key Brand Contributions and Market Position
Deckers primarily markets the Ugg and Hoka shoe brands, the two largest contributors to its revenue, making up approximately 68% and 29% of total sales, respectively. In the third quarter of fiscal 2025, both brands experienced notable consumer demand. Ugg saw a 16% rise in sales, while Hoka outperformed with a 24% increase. Despite a narrower brand portfolio, Deckers’ key products continue to appeal to consumers. However, investors are currently wary of tariff-related issues, as a significant portion of the company’s footwear is produced in Asia. The company’s current market capitalization stands at $19 billion, while revenue over the last twelve months was $4.9 billion, yielding $1.1 billion in operating profits and net income of $942 million.
Investment Strategies and Historical Earnings Reactions
Event-driven traders might benefit from historical patterns when positioning ahead of earnings or responding to the results. Strong performance in the past can suggest possible upside. Historical data shows that positive post-earnings returns were recorded 61% of the time over the last five years, increasing to 67% in the last three. The median positive return is 9.0%, while the median negative return is -2.1%. Observing these trends may provide traders with an edge in their strategies.
Deckers’ Historical Odds of Positive Post-Earnings Return
Here are key insights on one-day (1D) post-earnings returns:
- Over the last five years, there were 18 earnings data points, with 11 positive and 7 negative one-day returns. This indicates a 61% chance of positive returns.
- If examining just the last three years, the positive return percentage improves to 67%.
- The median of the positive returns is 9.0%, while the median of negative returns is -2.1%.
Correlation Between Short- and Medium-Term Returns
A strategic approach may involve analyzing the correlation between short-term and medium-term returns post-earnings. If a strong correlation exists, traders could consider going “long” based on positive 1D returns. Correlation data between historical 1D and subsequent 5D returns can aid in decision-making.

DECK Correlation Between 1D, 5D, and 21D Historical Returns
The views and opinions expressed herein are the views and opinions of the author and do not necessarily reflect those of Nasdaq, Inc.