

Western Digital’s Upcoming Earnings: A Crucial Quarter Ahead
Western Digital (NASDAQ: WDC) is expected to report its fiscal third-quarter earnings on Wednesday, April 30, 2025. Analysts forecast earnings of $1.11 per share on revenue of $2.48 billion. This represents a notable year-over-year decline of 65% in earnings and a 28% drop in revenue, compared to last year’s figures of $3.13 per share and $3.46 billion. This earnings release will be significant as it follows the company’s strategic separation from SanDisk, focusing solely on its core hard disk drive (HDD) sector.
Trends and Market Performance
Historically, Western Digital’s stock has decreased following earnings announcements 58% of the time, with a median one-day loss of 3.5% and a maximum decline of 12%. Currently, the company has a market capitalization of $14 billion. Over the past year, it generated $16 billion in revenue, yielding $2.5 billion in operating profit and $1.3 billion in net income, indicating the company remains operationally profitable.
Trading Strategies for Event-Driven Investors
For investors looking at potential strategies, understanding historical performance trends relative to actual earnings results can provide essential insights. Traders might consider two main approaches: positioning in anticipation of the earnings report using historical probabilities and consensus forecasts or reacting post-announcement by evaluating how returns typically align with reported results. For those interested in more stability than individual stocks, diversified investment options like high-quality portfolios could offer an alternative.

Image by K. Mishina from Pixabay
Western Digital’s Historical Earnings Performance
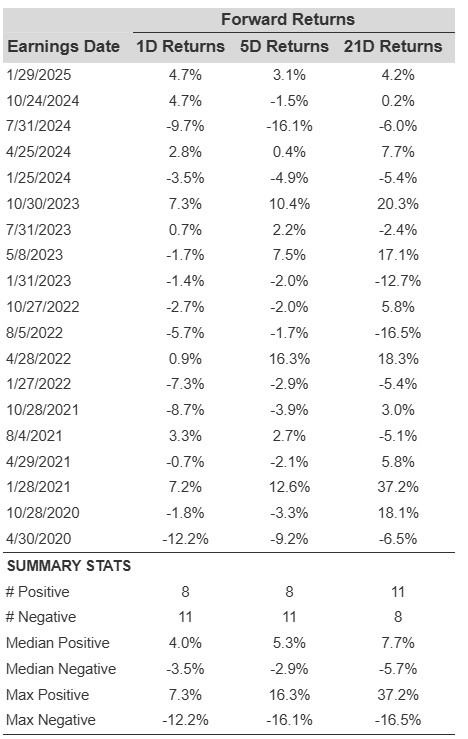
Examining the one-day (1D) post-earnings returns reveals important trends:
- Over the last five years, Western Digital has recorded 19 earnings data points, with 8 positive and 11 negative one-day (1D) returns, resulting in 42% of these returns being positive.
- This figure improves slightly to 45% when considering only the last three years.
- The median for positive returns stands at 4.0%, while the median for negative returns is -3.5%.
Additional data regarding observed 5-Day (5D) and 21-Day (21D) post-earnings returns are summarized in the table below.
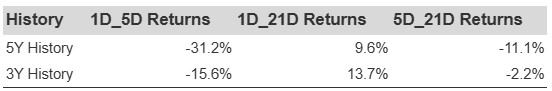
Understanding Correlations in Earnings Returns
A less risky approach might involve analyzing the correlation between short-term (1D) and medium-term (5D) returns following earnings announcements. By identifying pairs with strong correlations, traders can make more informed choices. For instance, if there is a strong correlation between the 1D and 5D returns, a trader may opt to go “long” for the next five days following a positive 1D return. See the correlation data detailed from both 5-year and 3-year histories below.
The views and opinions expressed herein are those of the author and do not necessarily reflect those of Nasdaq, Inc.


