Materials Select Sector ETF Dips Below Key Average
Shares of XLB Slide as Market Shows Weakness
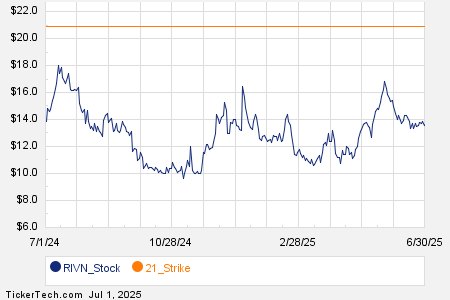
On Tuesday, shares of the Materials Select Sector SPDR Fund ETF (Symbol: XLB) fell beneath their 200-day moving average of $91.57, trading as low as $90.39 per share. Currently, XLB is down approximately 0.7% for the day. The chart below illustrates the one-year performance of XLB shares, compared to their 200-day moving average:

Reviewing the chart, XLB has a 52-week low of $80.735 per share and a high of $97.87, with the last trade recorded at $90.92.
Free Report: Top 8%+ Dividends (paid monthly)
![]()
![]() Click here to find out which 9 other ETFs recently crossed below their 200-day moving average »
Click here to find out which 9 other ETFs recently crossed below their 200-day moving average »
Also see:
- Warren Buffett Technology Stocks
- UFPI Next Dividend Date
- SITO Price Target
The views and opinions expressed herein are those of the author and do not necessarily reflect those of Nasdaq, Inc.