Investors are growing nervous … be careful about selling today … why investors would likely fire “God” if He was their portfolio manager … the payoff for holding your conviction
We’re publishing today’s Digest early to provide one final reminder that Luke Lango is going live this morning at 10:00 a.m. Eastern time with his Crypto Breakout Project.
As we detailed in yesterday’s Digest, Bitcoin just completed its fourth halving event. And if this halving is like the last one, the returns of some top performing altcoins will register in the quadruple digits over the next 12-18 months.
This isn’t hyperbole. After the third halving event in 2020, over 70 of the top-performing 300 altcoins saw their values skyrocket by more than 1,000% within roughly 18 months following the event.
This morning, Luke will detail a quantitative system that’s engineered to help investors find these moonshots.
Here’s Luke with more:
What cryptos should you be buying to give yourself a chance to make major returns in 2024?
Well, we’ve developed a powerful quantitative system to help you achieve just that.
To put it as succinctly as possible, it uses the core quantitative stage analysis strategy in High Velocity Stocks and modifies it slightly to find cryptocurrencies on the verge of a breakout – tokens that could soar hundreds of percent in a matter of days, weeks, and months.
This quant trading system has already proven highly successful in stock-picking…
And now, it’s precision-tuned to master gains in the crypto market.
If you’re a crypto investor, or simply looking for a high-octane corner of the market that has 10X potential over the next 18 months, this is your event.
To automatically join Luke, click here and we’ll see you at 10:00 a.m. Eastern.
Switching gears, this may be the most valuable Digest you read all year
I’m confident in making this bold claim because today’s Digest consists primarily of content written not by me, but by our macro expert, Eric Fry.
It’s not headline-driven… or filled with the best AI stocks… or promising the most accurate technical indicator… or anything along those lines.
But if internalized and followed, Eric’s market advice should make an extraordinary difference in your wealth. And perhaps equally important, it will make an extraordinary difference in your peace.
Stepping back, despite yesterday’s relief rally, stocks have sputtered over the last few weeks. As of last Friday, the S&P and Dow had fallen 5%, and the Nasdaq had dropped 6%.
Adding insult to injury, we’ve had a string of sessions during which stocks began the day higher, giving hope that the selling pressure had dried up…only then to roll over, ending the day flat or down.
As someone who looks at the markets and headlines all day, I’ve been noticing growing anxiety.
As just one example, CNN Business’ Fear & Greed Index pegs today’s market sentiment at “Fear,” quite the opposite of last month’s dominant emotion of “Greed.”

Source: CNN
If you’re feeling the urge to sell, I understand. And I can’t tell you that’s not the correct decision.
Based on your specific financial and life situation, perhaps taking profits off the table right now is the wisest choice. But before you do anything, please read today’s Digest.
At a minimum, it will provide an alternative perspective on the growing fear in today’s market.
Even God Would Get Fired as an Active Investor
Eric’s latest issue of Investment Report highlights a research piece by Wesley Gray, the CEO/CIO of Alpha Architect, who has a PhD in finance from the University of Chicago.
Gray’s piece is entitled “Even God Would Get Fired as an Active Investor.”
Let’s begin with Eric providing some context:
To conduct his study, Gray tracked the hypothetical portfolio only a “god-like” investor could have created by knowing “ahead of time exactly which stocks were going to be long-term winners and long-term losers.”
Spanning from the end of 1926 through the end of 2016, Gray’s researchers computed 5-year “look ahead” returns for the 500 largest U.S.-traded stocks, then split those results into deciles.
The top decile (i.e., 10%) contained the 50 stocks that would produce the largest gains over the following five years. The bottom decile contained the 50 worst-performing stocks over the following five years.
Gray’s “God portfolio” would buy the top decile of five-year gainers at the start of each five-year period, then rebalance the names in the portfolio on Jan. 1st of every fifth year.
As Gray explains in his paper, the results are what you would imagine. This heavenly portfolio produced fantastic five-year performance – a yearly return of nearly 29%, to be exact.
But camouflaged by that fantastic, overall return are some alarming details.
Back to Eric:
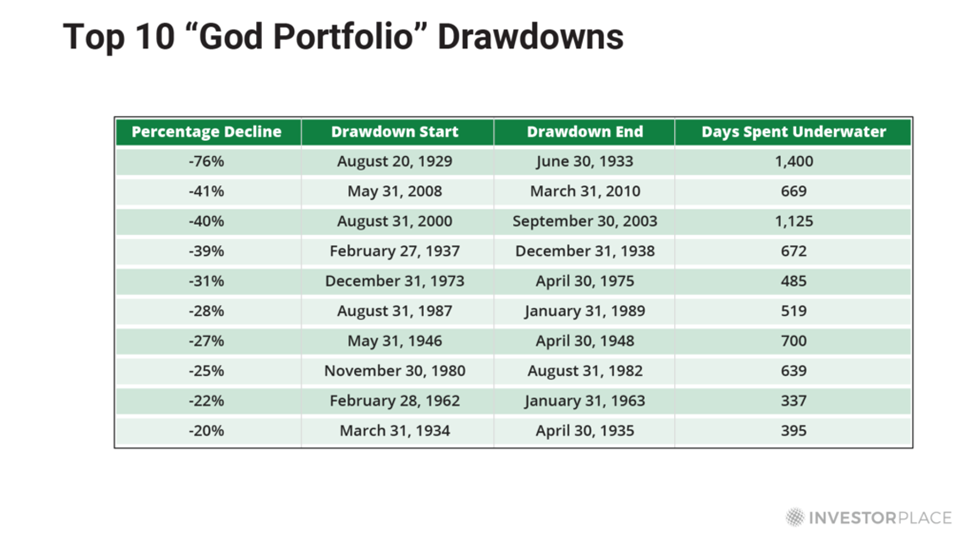
[Underneath the 29% average annual returns are] shockingly large drawdowns – or mark-to-market losses – the godly portfolio would have endured during its 90-year run.
For example, this “perfect portfolio” would have plummeted 76% from Aug. 1929 to May 1932, and spent nearly four years underwater.
But the pain didn’t end there.
On nine other occasions, the God portfolio would have suffered drawdowns ranging from 20% to 41%. The chart below details those bumps in the road.


Clearly, a “perfect portfolio” can deliver imperfect results for a time.
As Eric points out, it’s one thing to suffer through a 20% drawdown (not to mention a 74% drawdown) knowing the delightful outcome you’d eventually enjoy. But obviously, we don’t have that confidence.
As far as you and I know, a 20% drawdown could become 30%, 40%, or 80%… and it could last for many years.
Back to Eric:
We can never know what others will pay for [the stock we own] tomorrow. But if what we own is valuable, and is increasing in value over time, others will recognize that value eventually, and pay for it.
That basic strategy, coupled with dividends, is the essence of successful investing.
Timing Isn’t Everything
Here’s a hypothetical…
Let’s say you find a great company, maybe it even pays a fat dividend. But then you buy at precisely the wrong time. Say, the height of the Dot Com market bubble…
That would be a fatal error, right?
Perhaps, perhaps not.
In his issue, Eric asked his readers to consider a range of investments beginning on Mar. 31, 2000.
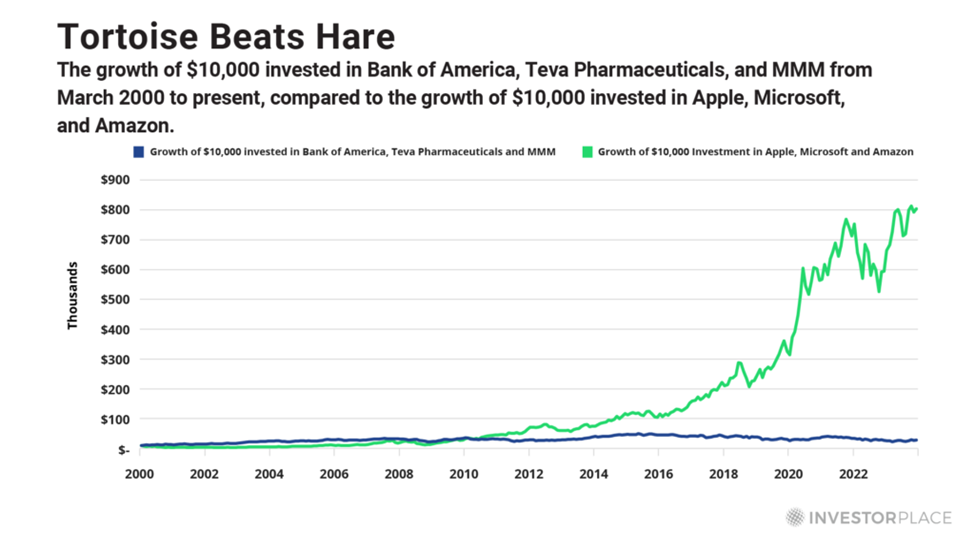
Specifically, “Investor A” spends $10,000 to buy a three-stock portfolio that holds equal amounts of Amazon.com Inc. (AMZN), Microsoft Corp. (MSFT), and Apple Inc. (AAPL). Eric calls this the “Future Leaders Portfolio.”
On that same date, “Investor B” spends $10,000 to buy a three-stock portfolio that holds equal amounts of Bank of America Corp. (BAC), Teva Pharmaceuticals Industries Ltd. (TEVA), and 3M Co. (MMM). This is the “Current Leaders Portfolio.”
Here’s Eric with the results:
Four years later, Investor B’s $10,000 would have grown to $24,261 in the Current Leaders Portfolio, while Investor A’s $10,000 would have shriveled to just $5,058 in the Future Leaders Portfolio.
But this illustration does not end in 2004.
Look what happens when we extend the analytical timeframe another 20 years to the present day.


Over the entire timeframe – from Mar. 2000 to Mar. 2024 – $10,000 grows to just $27,832 in the Current Leaders Portfolio, but skyrockets to $804,489 in the Future Leaders Portfolio.
But during the dark days of 2004, a result like this would have seemed unimaginable.
In that miserable moment, the Future Leaders Portfolio had spent the previous four years slashing a $10,000 investment in half.
Imagine you’re the owner of that Future Leaders Portfolio in that moment. Would you be able to hold?
Think realistically – facing, say, a child’s college tuition, or a home down payment, or a shriveling retirement savings account – would you be able to ride through a 50% drawdown?
Even if so, consider the stress and second-guessing that would likely leave you tossing and turning at night.
Back to Eric:
In the world of professional investing, any money manager who dared to allocate heavily to stocks like Microsoft, Amazon, and Apple during the early 2000s would have been fired long before 2004, if not also sued for daring to buy such pathetic “underperformers” like those.
But as Eric points out, short-term setbacks are not foolproof indicators of future results.
Most investors would penalize even perfection
In his research paper, Gray made a tweak.
To highlight the futility of prioritizing short-term results over long-term success, he converted the perfect “God portfolio” into a perfectly hedged God portfolio.
Gray tracked the results of buying the God portfolio, while simultaneously hedging it by selling short the lowest decile of future 5-year performers.
This “perfect” hedge fund would have produced a spectacular compound annual growth rate (CAGR) of 46%. No one has ever achieved a return like that over a prolonged period.
But here’s Eric with the twist:
[Despite this unbelievable market performance], as Gray points out, “God would get fired multiple times over.”
Why? Because the hedged God portfolio would have spent large periods of time “underperforming” the benchmark S&P 500 Index.
On multiple occasions, the God “hedge fund” would produce a return that trailed the S&P 500 by more than 50 percentage points!
The following quote comes directly from Gray’s paper:
The relative performance of God’s hedge fund is often abysmal… The [S&P 500] index would eat His lunch on multiple occasions…
These results highlight the fickle nature of assessing relative performance over short horizons…
Investors must have a long horizon!
What’s your conviction level when you find a strong company?
As Eric’s issue emphasizes, investors must have the strength of conviction to hold excellent stocks, even when they do not perform brilliantly at the outset and/or when popular opinion turns against them.
Of course, most investors lack such conviction. I’ll add in how the yearly results of the Dalbar studies illustrate this.
You’ve likely heard of the Dalbar studies. Since 1994, this investment research firm has published its Quantitative Analysis of Investor Behavior (QAIB) report that measures the stock market performance of the average retail investor.
As you might expect that performance is not great.
Consider the period from 1992-2022. This 30-year stretch covered the Dot-Com bubble/crash, 9/11, Global Financial Crisis, COVID pandemic and the bear market of 2022). Despite all this, the S&P 500 delivered an average annual return of 9.65%.
And how did the average U.S. equity mutual fund investor do over the same period?
According to Dalbar, thanks to our tendency to get scared and bail on stocks at the bottom and become greedy and buy stocks at the top, the average investor made just 6.81% per year. That’s nearly 30% less than the S&P 500.
Back to Eric:
We all know the phrase, “Buy low; sell high.” But too often we do the exact opposite because we lack the confidence to stay the course.
We get spooked out of a great stock, simply because its price falls for a while, and/or public opinion turns against it.
We allow our doubts to overrule our judgment…
Sometimes, of course, we misjudge the stocks we own. We bravely cling to a stock we believe to be a long-term winner, only to discover down the line that it was no such thing. We were simply wrong. That happens… to all of us.
But more often, our doubts are traitors.
What’s your tendency? Do you listen to your doubts and fears or evaluate the strength and/or weakness of your stocks?
In his issue, Eric zeroed in on Amazon in the wake of the Dot-Com bust when investors were punishing its stock price.
He noted that from March 2000 to March 2004, Amazon’s revenues tripled, while its annual net income flipped from a negative $1.5 billion to a positive $156 Million.
And how did Wall Street reward that brilliant performance?
By mass selling that crashed Amazon’s share price as much as 90%.
Imagine you were an Amazon investor during this period. Maybe you’d be able to hold if you remained focused on this operational excellence. Even then, it’s doubtful.
But if you had been focused on Amazon’s plummeting stock price? I’d give you a near-zero chance.
We’re running long so I’ll begin to wrap this up
Who knows what the coming weeks/months/years will bring for the market and your specific portfolio.
But as Eric’s issue stresses, your long-term wealth will come from the combination of fantastic companies and patience. But don’t expect that to be easy.
Consider the typical tradeoff…
Following your emotions in the short-term often feels the best, but results in disappointing long-term performance.
Meanwhile, following discipline and logic in the short-term usually feels the worst, but often provides far better long-term performance.
This echoes the quote from Rob Arnott, founder of Research Affiliates:
In investing, what is comfortable is rarely profitable.
Back to Eric’s issue:
We abandon stocks that have great potential, simply because we expect too much too soon, and/or we believe that short-term price declines foreshadow long-term price declines.
I call this type of mistake the “Tyranny of the Immediate.”
This tyranny that prioritizes short-term results over long-term potential. It demands being right, right now. By doing so, it often sabotages the opportunity to capture large long-term gains.
Eric provides a handful of examples, one of which his Speculator subscribers experienced not too long ago.
In November 2019, Eric recommended a trade on Aviat Networks Inc. (AVNW). Just four months later, the position had slumped nearly 50%.
Today, the subscribers who acted on Eric’s initial recommendation and held through that drawdown would be sitting on a 400% gain.
To what extent are you at risk of allowing the Tyranny of the Immediate to derail your long-term wealth creation?
I’ll let Eric take us out:
Even legendary stocks will try the patience and endurance of investors from time to time… en route to delivering their market-trouncing returns…
Holding onto “losers” is not comfortable… and does not always produce immediate success. But the juice is often worth the squeeze.
Have a good evening,
Jeff Remsburg


