ETFs Experience Changes: Spotlight on TLT
Week-over-week data reveals that the iShares 20+ Year Treasury Bond ETF (Symbol: TLT) has experienced a substantial outflow of approximately $358.9 million. This reflects a 0.6% reduction, with shares outstanding dropping from 643,400,000 to 639,500,000.
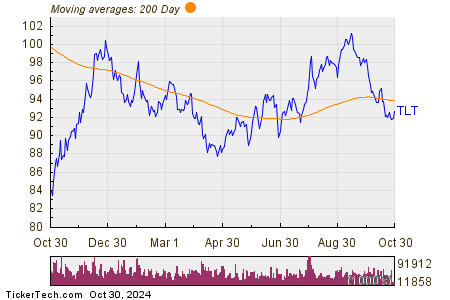
The chart below illustrates TLT’s price trends over the past year compared to its 200-day moving average:

According to the chart, TLT has a low point of $83.55 per share and a high point of $101.64 within its 52-week range. The most recent trading price stands at $92.79. Analyzing the most recent share price in relation to the 200-day moving average offers valuable insights for investors — learn more about the 200-day moving average.
Exchange Traded Funds (ETFs) function similarly to stocks; however, investors trade in “units” rather than “shares.” These units can be bought and sold like stocks but can also be created or destroyed based on market demand. Regular monitoring of week-over-week changes in shares outstanding helps identify ETFs with significant inflows (indicating new units created) or outflows (indicating units destroyed). When new units are created, it requires purchasing the underlying securities. Conversely, when units are destroyed, the corresponding underlying assets must be sold, which can influence the performance of the securities held within the ETF.
![]() Click here to find out which 9 other ETFs experienced notable outflows.
Click here to find out which 9 other ETFs experienced notable outflows.
Also see:
- ABOS Average Annual Return
- CX Historical Stock Prices
- TAMG Options Chain
The views and opinions expressed herein are those of the author and do not necessarily reflect those of Nasdaq, Inc.

