Analysts Expect Growth for Invesco S&P MidCap Quality ETF
In examining the ETFs in our coverage, ETF Channel has assessed the average analyst 12-month forward target prices against current trading prices. For the Invesco S&P MidCap Quality ETF (Symbol: XMHQ), the implied analyst target price is $113.55 per unit.
Potential Upside for XMHQ
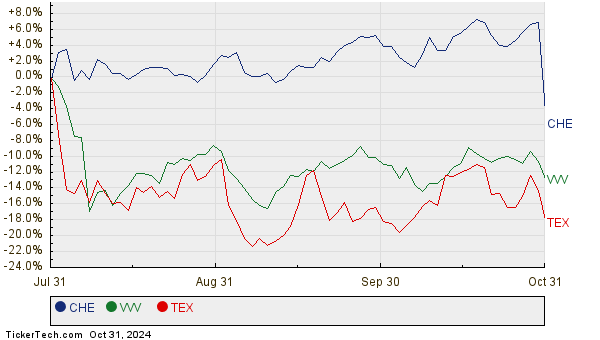
Currently, XMHQ is trading at approximately $100.03 per unit, suggesting a promising 13.52% upside based on analyst forecasts. Notably, three of its underlying holdings show substantial potential for growth: Chemed Corp (Symbol: CHE), Valvoline Inc (Symbol: VVV), and Terex Corp. (Symbol: TEX). CHE’s recent trading price is $535.80 per share, while its average analyst target is $685.00, indicating an impressive 27.85% upside. VVV, with a recent price of $40.45, stands to gain 14.62% if it reaches the analysts’ average target of $46.36. Finally, TEX is expected to rise 13.53% from its current price of $51.53 to a target of $58.50 per share.
Stock Performance History
Below is a twelve-month price history chart comparing the stock performance of CHE, VVV, and TEX:

Summary of Analyst Targets
The following table summarizes the current analyst target prices for the discussed stocks:
| Name | Symbol | Recent Price | Avg. Analyst 12-Mo. Target | % Upside to Target |
|---|---|---|---|---|
| Invesco S&P MidCap Quality ETF | XMHQ | $100.03 | $113.55 | 13.52% |
| Chemed Corp | CHE | $535.80 | $685.00 | 27.85% |
| Valvoline Inc | VVV | $40.45 | $46.36 | 14.62% |
| Terex Corp. | TEX | $51.53 | $58.50 | 13.53% |
Are Analyst Targets Realistic?
Investors may wonder if analysts’ targets are justified or overly optimistic. The target prices may reflect optimistic views about future growth, but they could also be outdated in light of recent developments. A higher target compared to the current trading price requires careful consideration. Investors should conduct further research into these companies and sectors to gauge the precision of these predictions.
![]() 10 ETFs With Most Upside To Analyst Targets »
10 ETFs With Most Upside To Analyst Targets »
Also see:
• Split History
• CSRA Videos
• TLP market cap history
The views and opinions expressed herein are the views and opinions of the author and do not necessarily reflect those of Nasdaq, Inc.

