SPDR MSCI ACWI ex-US ETF Struggles Below Key Moving Average
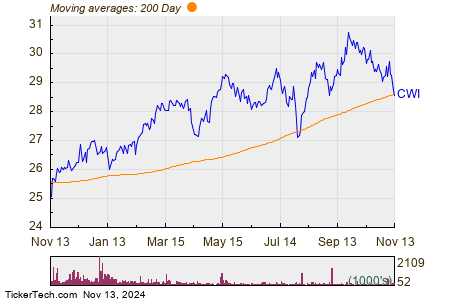
In trading on Wednesday, shares of the SPDR MSCI ACWI ex-US ETF (Symbol: CWI) fell below their 200-day moving average of $28.61. The stock traded as low as $28.49 per share, indicating a decline of approximately 0.6% for the day. Below, we present the one-year performance of CWI shares plotted against their 200-day moving average:

According to the chart, CWI’s lowest point in the past 52 weeks is $25.49 per share, while its highest point reached $30.9284. The latest trade for the shares was $28.59.
Free Report: Top 8%+ Dividends (paid monthly)
![]() Click here to discover which 9 other ETFs have recently dipped below their 200-day moving average »
Click here to discover which 9 other ETFs have recently dipped below their 200-day moving average »
Further Information:
NAUH Historical Stock Prices
Funds Holding JKK
CWBC Historical Stock Prices
The views and opinions expressed herein are the views and opinions of the author and do not necessarily reflect those of Nasdaq, Inc.

