Potential Gains Ahead: Analyzing Analysts’ Price Targets for SPLG and Its Holdings
In our analysis of ETFs at ETF Channel, we investigated the trading prices of individual stocks held within the SPDR Portfolio S&P 500 ETF (Symbol: SPLG). By evaluating these against average analyst 12-month forward target prices, we identified an implied target price of $76.19 per unit for SPLG. Currently, the ETF’s trading price is around $69.18 per unit, indicating analysts project a possible 10.13% upside based on their predictions for the underlying holdings.
Key Holdings with Notable Upside Potential
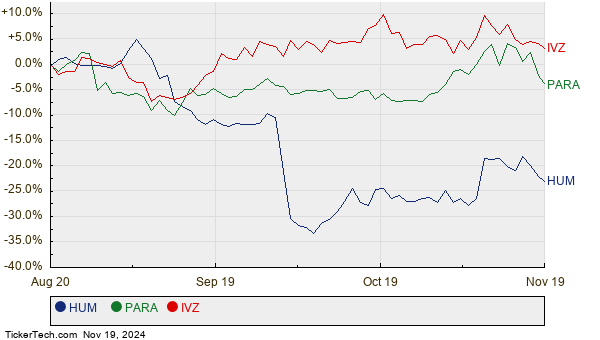
Among SPLG’s top stocks, three show considerable upside relative to their analyst target prices: Humana Inc. (Symbol: HUM), Paramount Global (Symbol: PARA), and Invesco Ltd (Symbol: IVZ). Humana Inc. is currently priced at $271.35 per share, yet analysts believe it could hit $301.00 in the next year, suggesting a 10.93% increase. Paramount Global, trading at $10.61, has a target of $11.74, which represents a 10.63% potential gain. Similarly, Invesco Ltd’s recent price of $17.47 is expected to rise to a target of $19.27, equating to a 10.28% increase. The following chart provides a twelve-month performance comparison for HUM, PARA, and IVZ:

Analyst Target Summary
Below is a summary table of these target prices:
| Name | Symbol | Recent Price | Avg. Analyst 12-Mo. Target | % Upside to Target |
|---|---|---|---|---|
| SPDR Portfolio S&P 500 ETF | SPLG | $69.18 | $76.19 | 10.13% |
| Humana Inc. | HUM | $271.35 | $301.00 | 10.93% |
| Paramount Global | PARA | $10.61 | $11.74 | 10.63% |
| Invesco Ltd | IVZ | $17.47 | $19.27 | 10.28% |
Evaluating Analysts’ Stock Predictions
The crucial question remains: Are analysts being realistic with their targets, or could they be overly optimistic? High price targets can signal trust in future growth, yet they can also precede price downgrades if they don’t align with current market realities. Investors should consider these aspects carefully before making decisions.
![]() 10 ETFs With Most Upside To Analyst Targets »
10 ETFs With Most Upside To Analyst Targets »
Also see:
• ENI Split History
• Funds Holding FLEU
• CUE Market Cap History
The views and opinions expressed herein are the views and opinions of the author and do not necessarily reflect those of Nasdaq, Inc.

