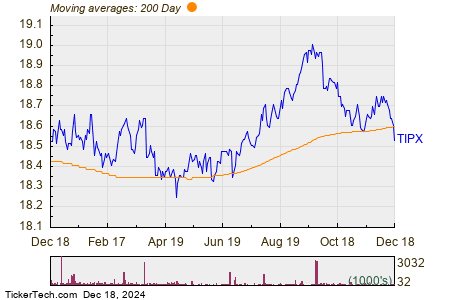
On Wednesday, trading saw shares of the SPDR Bloomberg 1-10 Year TIPS ETF (Symbol: TIPX) drop below their 200-day moving average of $18.60, reaching a low of $18.54 per share. Currently, SPDR Bloomberg 1-10 Year TIPS shares are down approximately 0.4% for the day. The chart below illustrates the one-year performance of TIPX shares in relation to its 200-day moving average:

From the chart, we can see that TIPX’s 52-week low reached $18.2031 per share, while its high was $19.02. Presently, the last trade was at $18.53.
![]() Click here to find out which 9 other ETFs recently crossed below their 200-day moving average »
Click here to find out which 9 other ETFs recently crossed below their 200-day moving average »
Related Information:
- EKN Videos
- CMB Historical Stock Prices
- FRAF Shares Outstanding History
The views and opinions expressed herein are those of the author and do not necessarily reflect those of Nasdaq, Inc.

