Predicting the S&P 500: Insights into Global Liquidity
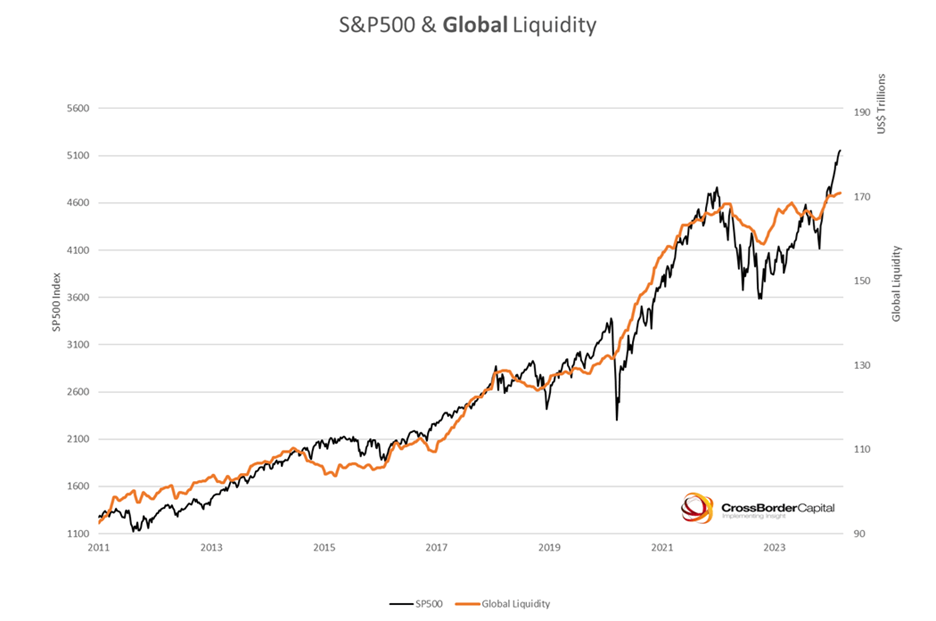
The correlation between global liquidity and the S&P 500 can be surprisingly strong, reaching around 85%.
Many investors make a common mistake when trying to forecast the S&P 500. They focus too much on U.S. measures like:
- U.S. CPI
- U.S. interest rates
- U.S. M2 supply (a measure of liquid assets in the economy)
While these indicators are important, they’re not the whole picture. Unlike many countries, the U.S. stock market is influenced by global flows of money. For instance, while residents in Germany may not typically invest in Japanese stocks, they are likely to invest in major U.S. companies such as Nvidia, Apple, and Microsoft.
When central banks expand the money supply, that money circulates locally but often ends up in global asset markets. A significant portion is invested in S&P 500 companies, which means that understanding global liquidity is crucial for predicting movements in the index.
However, measuring global liquidity accurately is tricky. Aggregating M2 and interest rate data from central banks worldwide adds another layer of complexity. Traditional financial platforms like Ycharts and TradingView often lack a global liquidity metric, leading many investors to track only the five largest central banks:
- Bank of Japan
- Federal Reserve
- Bank of England
- European Central Bank
- People’s Bank of China
This focus can lead investors astray. The S&P 500 is not solely affected by the Fed; it is impacted by monetary policies across the globe. Changes in liquidity from the Bank of Japan, Bank of England, European Central Bank, and People’s Bank of China play a significant role that often gets overlooked.
The strength of this connection becomes clear when examining U.S. stock indexes. For example, popular indexes like the NASDAQ display a 95% correlation to global liquidity, while the S&P 500 maintains around an 85% correlation.
However, there are times when global liquidity and the S&P 500 may seem disconnected, particularly during bullish market phases fueled by significant news events. For instance, the stock market surged after Trump’s election victory, even amidst concerns about traditional measures of liquidity. Similarly, major economic shocks—such as the financial crisis of 2008 or the initial COVID-19 scare—can also create temporary disconnects.
Despite these fluctuations, historical trends show that the market does realign with global liquidity over time. It’s crucial to note that this process is not instantaneous; it takes time for liquidity to infuse assets, leading to price changes. The sequence is clear: increased liquidity tends to drive up stock prices as demand grows against a limited supply.
The key takeaway?
Broaden your analysis beyond just U.S. monetary policy. Pay attention to global central banks. By doing so, you can more reliably predict the movements of major U.S. stock indexes, albeit with some time lag.
**
Hello!
Join the WOLF Financial Newsletter today!
Join a community of over 13,000 smart investors sharing insights and strategies on Twitter Spaces. Don’t miss out:
Subscribe
WOLF Financial focuses on driving liquidity, growth, and awareness in both traditional finance and cryptocurrency sectors. Learn more Here.
Want to enhance your investing skills?
Check out the Blossom investing app to connect with over 100,000 investors.
Plus, you’ll get a glimpse into my investment portfolio. It’s free—give it a try: https://www.blossomsocial.com/wolffinancial
© 2025 Benzinga.com. Benzinga does not provide investment advice. All rights reserved.