An Inside Look at Dividend Investing
Amidst the diverse array of investment strategies, dividend investing emerges as a stalwart and time-honored method, blending a steady income stream from dividends with the potential for prolonged growth from the underlying holdings.
Amidst the ever-shifting landscape of investments, dividend investing has proven to be a bastion of stability, offering a reliable means of bolstering our portfolios while affording a shield against the tumultuous market forces. Furthermore, dividend investing has carved a niche as a low-volatility strategy, serving as a steadfast avenue for securing enduring income over the span of numerous years.
In this feature, we set out to dissect two quintessential Exchange Traded Funds (ETFs) tailored for dividend and income investors— the JPMorgan Equity Premium Income ETF (NYSEARCA:JEPI) and the Schwab U.S. Dividend Equity ETF (SCHD). Each ETF is uniquely structured, yet both share the common objective of dispensing recurrent distributable income while maintaining lower volatility than the broader equity market.
While some argue that SCHD and JEPI are not directly analogous, they undeniably reign as two of the prevailing instruments for accruing periodic income.
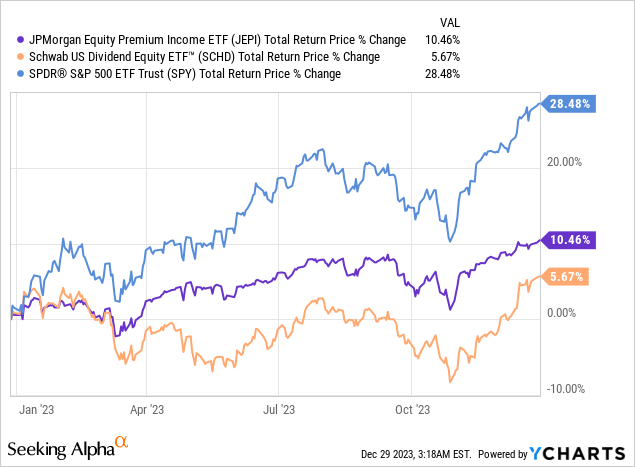
Although these two ETFs endeavor to deliver stable periodic returns with minimal volatility, their performance has not consistently surpassed that of (SPY) over a three-year period. There were fleeting instances of these ETFs outperforming SPY, such as in October 2022, but their glory was short-lived, as they were promptly overtaken in the subsequent 12 months.
Still, as we shall soon uncover, an array of compelling reasons exists for integrating an ETF into one’s investment portfolio.
In addition, we intend to probe into the construction of each of these two ETFs. This exploration is bound to lead us into an analysis of the strategies underpinning JPMorgan (JPM) and Schwab (SCHW) in regard to their respective ETFs, as well as a scrutiny of the performance of these ETFs.
What Makes ETFs Tick?
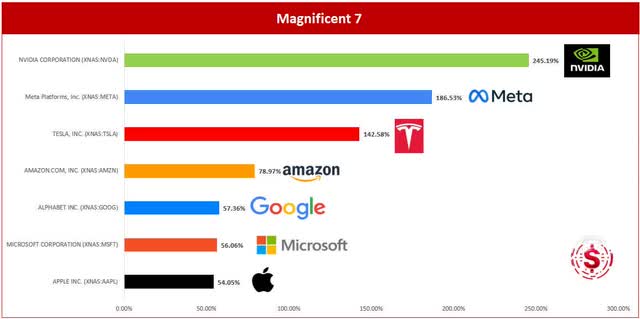
Emulating the Magnificent 7, Nvidia (NVDA) soared by nearly 250% in the previous year. As evidenced in the chart below from our ‘X’ piece, where we delved into the leading gainers of 2023, even the poorest performer amongst the Magnificent 7, Apple (AAPL), still yielded a return exceeding 54.05%!
One might ponder – should I simply invest in Microsoft (MSFT), Tesla (TSLA), Alphabet (GOOGL)(GOOG), Amazon (AMZN), Meta (META)…? There are undoubtedly compelling arguments in favor of such a move. In the subsequent sections, we aim to elucidate the advantages of immersing oneself in a dividend ETF, and when it comes to the deliberation between SCHD and JEPI, one clearly emerges as the prime choice!
One might ponder – why invest in an ETF? If seeking a low-risk investment entailing a diverse array of stocks or other securities for heightened diversification, ETFs emerge as a compelling option. They are generally deemed cost-effective and boast markedly lower expense ratios than actively managed funds characteristic of hedge funds or mutual funds. Moreover, ETFs offer the prospect of instantly reinvesting dividends – an enticing prospect, isn’t it?
ETFs afford exposure to an array of stocks within a specific industry, security, country, or broad market index. Essentially, these vehicles encapsulate a myriad of securities in a singular product, facilitating swift diversification of one’s portfolio. ETFs can also encompass asset classes beyond equities, including bonds, currencies, and commodities.
This ease of diversification does come with a nominal annual fee, known as the expense ratio, which can range from moderately substantial to virtually negligible. For JEPI and SCHD, the expense ratios stand at 0.35% and 0.06%, respectively.
By way of comparison, popular ETFs such as ARK Innovation ETF (ARKK) or the YieldMax TSLA Option Income ETF (TSLY) sport expense ratios of 0.75% and 0.99%, correspondingly. Hence, the expense ratio for SCHD and JEPI resides within the realm of insignificance.
One could indeed painstakingly construct a portfolio mirroring JEPI or SCHD, but for many, the time and effort requisite for managing such an endeavor might prove too taxing.
Beyond endowing you with diversification, ETFs differ notably in their management. For instance, JEPI endeavors to generate income via the sale of covered calls on its stock holdings. Covered calls signify a widely employed options strategy that empowers the seller (in this instance, JP-Morgan) to amass a premium on the options they vend. Conversely, SCHD fixates on higher-yielding companies and adopts a far more passive approach to amassing dividends. Furthermore, SCHD strives to replicate the Dow Jones US Dividend 100 Index (DJUSDIV).
Evidently, as we shall soon unfold, while we might harbor a preference for one ETF over the other, both JEPI and SCHD yield exposure to an array of sectors.
Penetrating the Essentials
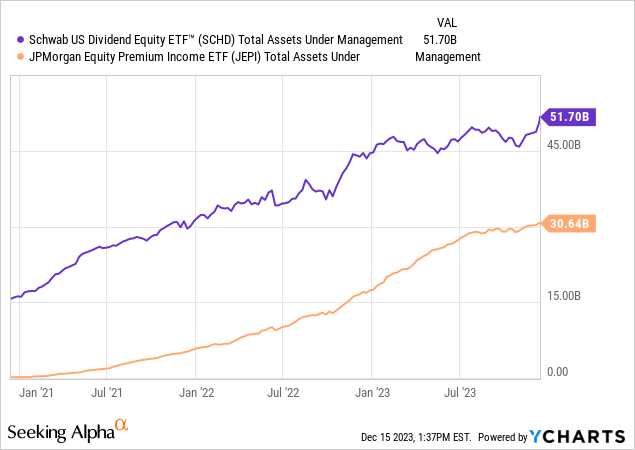
It is imperative to comprehend the essence of the investment you’re making when selecting between JEPI and SCHD (or conceivably, opting for both). JEPI administers around $30.6B in assets, while SCHD takes charge of $51.7B at the moment of this composition, and their holdings diverge significantly.
Outlined below is a table delineating the top 10 holdings of JEPI and SCHD and the proportion each contributes to the overall portfolio.
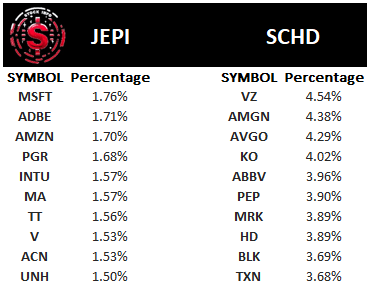
SCHD adopts a more concentrated approach, with its top 10 holdings accounting for over 40% of the ETF’s aggregate. Contrarily, JEPI takes a less concentrated stance, with its top 10 holdings constituting just over 16% of its assets under management.
Furthermore, the types of stocks held by the two ETFs are notably distinct. Astute investors may discern that SCHD holds
In-Depth Comparison of JEPI and SCHD ETFs
Investors seeking stable returns and income are presented with manifold options, among which stand Verizon (VZ), AbbVie (ABBV), and Texas Instruments (TXN) as the prominent dividend-paying stocks. Notably, however, JEPI and SCHD emerge as frontrunners in scope and viability given their divergent, yet equally appealing, methodologies.
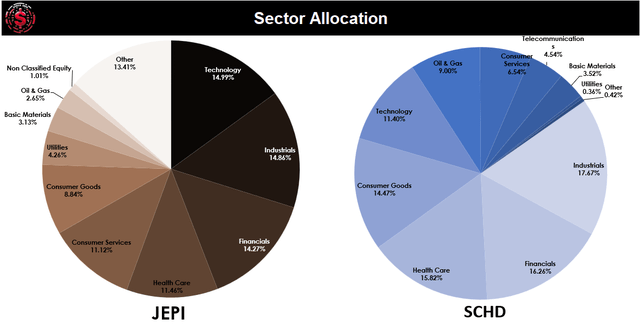
Understanding Sector Allocation
What sets these two ETFs apart is the elemental variance in their sector allocation. JEPI is decidedly pro-tech, boasting a plethora of tech stocks, while SCHD leans more toward industrials. Furthermore, the oil and gas sector represents merely 2.65% of JEPI, rendering it a more flagship feature of SCHD, accounting for a noteworthy 9.00%. This divergence is echoed in their performance volatility and susceptibility to market forces.
Investment Considerations
Given the distinctions in sector allocation, investors are prompted to deliberate on their preferences for investment exposure. JEPI’s tech-heavy allocation makes it more susceptible to interest rate hikes, whereas SCHD’s pronounced interest in industrials shields it from this concern. On the flip side, the industrials’ dependency on market cyclicality and oil price fluctuations entails its own set of risks — a conundrum faced by many in these volatile times.
Ultimately, the onus lies on the investor to analyze their risk tolerance, investment horizon, and income objectives before selecting the most fitting ETF.
Strategic and Methodological Variances
The catalyst of disparity between JEPI and SCHD resides in the underlying philosophies dictating their construction and operational strategies, both pioneering yet fundamentally contrasting.
Deciphering the JEPI Strategy
JEPI’s preeminence lies in its resplendent yield, serving as a compelling refuge during periods of duress in the Treasury market. This exemplary income alternative was starkly evident in 2022’s double-digit losses, underscoring JEPI’s valor as a reliable source of positive returns during lean times.
Distinguished by active management, JEPI eschews the static approach of comparable covered call funds and embraces a dynamic security selection. A consequential turnover rate of approximately 190% underscores its leanings toward pragmatic trading, fostering a distinctive advantage over static funds.
JEPI’s strategic focus on S&P 500 Index-listed companies, supplemented by equity-linked notes (ELNs) and covered call options, represents a shrewd investment outlook. The deployment of ELNs, meticulously constructed to emulate the S&P 500 Index, bestows JEPI with unparalleled stability and resilience against market vicissitudes.
Decoding the SCHD Strategy
Functioning as a conduit for capitalizing on dividend-paying U.S. stocks, SCHD extols the virtues of robust returns and portfolio risk mitigation. Founded on DJUSDIV, comprising stalwart dividend-paying companies, SCHD curates a unique mix by excluding specific stocks and introducing an alternative weighting blueprint distinct from the underlying index.
The onus on consecutive years of dividends and stringent market capitalization criteria underscores SCHD’s penchant for fortitude and consistency, reinforcing its status as a risk-averse investment option.
As investors embark on parsing through these distinctive strategies, it’s beholden upon them to align their investment proclivities with the nuances of each ETF, cognizant of the variance in their approaches and implications for risk management and income generation.
Comparing JEPI and SCHD ETFs: A Detailed Analysis for Investors
In the fast-paced world of exchange-traded funds (ETFs), investors are constantly on the lookout for the next best opportunity to maximize returns while minimizing risk. Two popular ETFs, JEPI and SCHD, have garnered significant attention from investors seeking exposure to the equities market. While both aim to generate better-than-average returns with low volatility, a closer look reveals unique strategies and performance. Let’s delve into a detailed comparison to help investors navigate these options.
Distinctive Strategies
JEPI employs an active approach, relying on the expertise of its managers to select high-quality stocks and utilize covered calls. In contrast, SCHD follows a more passive strategy by tracking an index of high dividend yielding stocks. JEPI’s active management, designed to outperform the market, contrasts with SCHD’s goal of mirroring index performance.
A Comparison of Performance
When it comes to returns, SCHD has shown strong performance over a three-year period, outpacing JEPI. However, JEPI demonstrated a superior return in 2023, significantly surpassing SCHD. Additionally, JEPI exhibited lower volatility, appealing to risk-averse investors seeking stability in their investments.
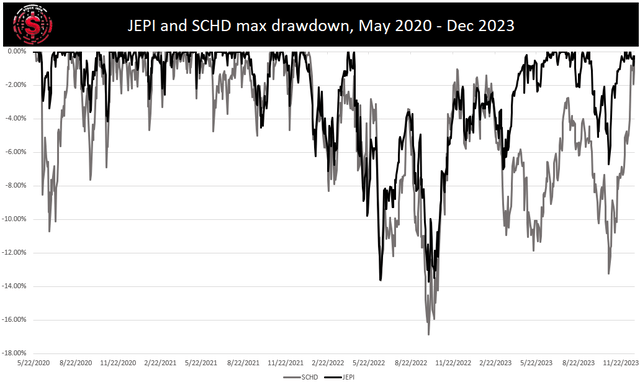
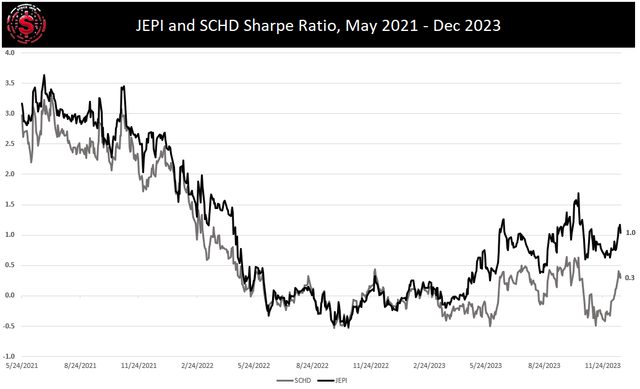
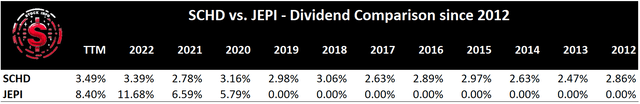
By analyzing the drawdown, we find that JEPI experienced lower declines in value compared to SCHD, indicating a lower level of risk. Furthermore, when considering the Sharpe ratio, JEPI boasts a more attractive metric, signaling better risk-adjusted returns. In terms of dividend yield, JEPI also stands out with a significantly higher yield than SCHD.
Risks
Both ETFs carry exposure to systemic risk, but they exhibit differences in sector exposure and stock selection, impacting their risk profiles. JEPI’s active management introduces specific risks related to stock selection and covered calls, while SCHD’s passive approach still carries inherent market risks.
The Battle of JEPI vs. SCHD: Unveiling the Superior Investment
Choosing between JEPI and SCHD is akin to selecting a travel path: do you opt for the scenic route with a few bumps, or the expressway with a smoother, but potentially riskier journey?
The Trade-Off: Growth vs. Income
JEPI’s approach of writing covered calls to generate income necessitates accepting a trade-off by capping potential upside gains in favor of income during bear markets. This strategy may have limited the potential gain during the recent bull run, although it allowed for gain collection and premium receipt. Conversely, SCHD does not face these caps on gains but is more susceptible to downswings, as demonstrated by the drawdown graph. Additionally, SCHD’s heavy allocation to oil and gas presents a larger geopolitical risk than JEPI.
Comparative Superiority
Even though SCHD may shine over JEPI on a longer time horizon, JEPI’s lower volatility and remarkable dividend yield position it as the superior choice. When seeking an enticing product with broad market exposure and reduced portfolio volatility, JEPI is the precise solution. Furthermore, the high dividend yield facilitates reinvestment of the ETF’s distributed income, compounding gains in the coming years.
As Einstein referred to compound interest as the eighth wonder, Warren Buffet labeled it the investor’s best friend. Leveraging compound interest with JEPI is a robust strategy for building wealth in 2024 and beyond. The superior Sharpe ratio and lower drawdown of JEPI solidify its appeal as the investment of choice over SCHD. A Sharpe ratio of 1, compared to the alternative’s 0.3, leaves little room for debate.
Market Outlook: JEPI’s Time to Shine
Looking ahead to 2024, the uncertain timing of rate cuts may inject volatility into the markets. It is precisely under these conditions that the strength of JEPI is expected to shine. Therefore, the consensus leans heavily toward JEPI as the preferred investment over SCHD.
Ultimately, the battle between JEPI and SCHD is decisively tipped in favor of JEPI, emerging as the quintessential investment avenue for discerning investors.
5 Stocks Our Experts Predict Could Double In the Next Year
By submitting your email, you'll also get a free pivot & flow membership. A free daily market overview. You can unsubscribe at any time.