Bilibili’s Q3 Earnings Show Mixed Results Amid Rapid Growth in Mobile Games
Bilibili (BILI) announced non-GAAP earnings of 8 cents per share for the third quarter of 2024, which fell short of the Zacks Consensus Estimate by 20%. A year ago, the company reported a loss of 29 cents per share.
Check out the latest EPS estimates and surprises on Zacks Earnings Calendar.
Strong Revenue Growth Outpaces Expectations
Bilibili’s revenues climbed to $1.02 billion, which exceeded the Zacks Consensus Estimate by 0.76%. When measured in RMB, revenues increased by 25.8% year over year to RMB 7.31 billion.
In pre-market trading, BILI shares rose by 1.83%. Year to date, the company’s stock has outperformed the Zacks Computer & Technology sector, gaining 52.8% compared to the sector’s 29.3% return.
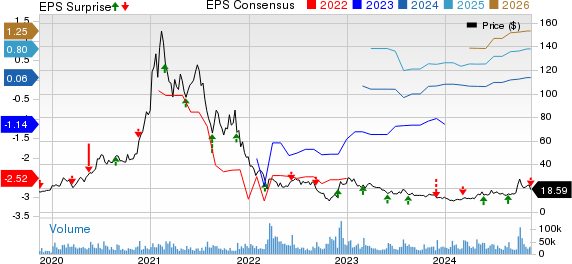
Bilibili Inc. Sponsored ADR Price, Consensus and EPS Surprise
Bilibili Inc. Sponsored ADR price-consensus-eps-surprise-chart | Bilibili Inc. Sponsored ADR Quote
Mobile Games Drive Revenue Growth
Mobile game revenues, which represent 24.9% of total revenues, surged by 83.8% year over year to RMB 1.82 billion.
Value Added Services (VAS) revenues, making up 38.6% of total revenues, saw an increase of 8.7% year over year to RMB 2.82 billion.
Advertising revenues accounted for 28.7% of total revenue, rising by 27.8% year over year to RMB 2.09 billion.
Revenue from IP Derivatives and other services, contributing 7.8% of total revenues, decreased by 2.2% year over year to RMB 567.31 million.
Operating Efficiency Improves
During the third quarter of 2024, Bilibili’s gross profit margin improved to 34.9%, up from 25% in the same quarter last year.
Research and development (R&D) expenses dropped by 15% year over year to RMB 906.1 million, decreasing as a percentage of sales by 600 basis points (bps) to 12.4%.
Sales & Marketing (S&M) expenses rose 21.2% year over year to RMB 1.2 billion, though as a percentage of sales, these expenses fell by 60 bps to 16.5%.
General & Administrative (G&A) expenses climbed 1.3% year over year to RMB 505.4 million but decreased as a percentage of sales by 170 bps to 6.9%.
Total operating expenses reached RMB 2.61 billion, an increase of 2.2% from the previous year. The non-GAAP loss from operations was RMB 272.2 million, a significant improvement from the RMB 755.4 million loss reported a year ago.
Strong Financial Position
As of September 30, 2024, Bilibili had cash and cash equivalents (including short-term investments) totaling RMB 11.7 billion, compared to RMB 8.76 billion as of June 30, 2024.
Total debt decreased to RMB 5.02 billion as of September 30, 2024, from RMB 5.58 billion at the end of June 2024.
Operating cash flow was RMB 2.23 billion for the quarter, a significant increase compared to RMB 277.4 million in the previous quarter.
Bilibili’s Outlook and Peer Comparisons
Bilibili currently holds a Zacks Rank #2 (Buy).
Other top-rated stocks in the sector include Tuya (TUYA), NVIDIA (NVDA), and NetApp (NTAP). Tuya and NVIDIA both have a Zacks Rank #1 (Strong Buy), while NetApp is also ranked #2. Click here to view the complete list of Zacks #1 Rank stocks.
Despite a challenging year, Tuya’s shares have decreased by 33.1% year-to-date and is expected to report third-quarter 2024 results on November 18.
Meanwhile, NVIDIA’s shares have surged 196.3% year to date, with its third-quarter fiscal 2025 results due on November 20.
NetApp has seen a year-to-date increase of 34% and is set to announce second-quarter fiscal 2025 results on November 21.
Mentioned Opportunities in Solar Market
The solar industry is poised for substantial growth as the economy shifts towards cleaner energy sources. Analysts estimate that solar will account for 80% of the renewable energy expansion in the coming years, creating ample investment opportunities. Careful stock selection will be crucial for capitalizing on this trend.
NVIDIA Corporation (NVDA) : Free Stock Analysis Report
Bilibili Inc. Sponsored ADR (BILI) : Free Stock Analysis Report
Tuya Inc. Sponsored ADR (TUYA) : Free Stock Analysis Report
NetApp, Inc. (NTAP) : Free Stock Analysis Report
To read this article on Zacks.com click here.
Zacks Investment Research
The views and opinions expressed herein are the views and opinions of the author and do not necessarily reflect those of Nasdaq, Inc.


