Burlington Stores Q3 Earnings Report: A Mixed Bag with Stronger Profitability
Burlington Stores, Inc. (BURL) has released its financial results for the third quarter of fiscal 2024, showcasing mixed outcomes: while sales fell short of expectations, earnings surpassed forecasts. On a positive note, both revenue and earnings showed year-over-year growth.
Sales Performance Affected by Weather, But Key Metrics Show Resilience
The company experienced solid performance in the early days of the quarter. However, a warmer mid-September impacted sales, especially in the winter clothing categories. When excluding these colder items, comparable sales demonstrated steady growth, aligning with recent trends. Improved inventory and liquidity management also contributed to enhanced margins and growth in earnings. Looking ahead to the holiday season, the company has a cautious yet optimistic sales outlook for the fourth quarter.
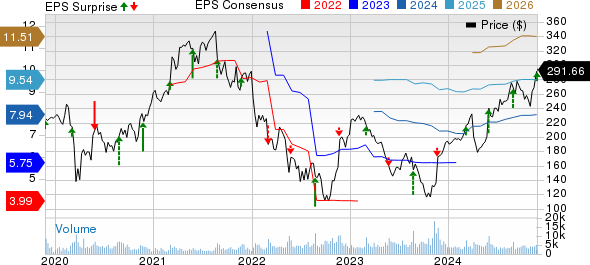
Burlington Stores, Inc. Price, Consensus, and EPS Surprise
Burlington Stores, Inc. price-consensus-eps-surprise-chart | Burlington Stores, Inc. Quote
Diving Deeper into Burlington’s Q3 Financial Results
For the third quarter, Burlington Stores reported adjusted earnings of $1.55 per share, exceeding the Zacks Consensus Estimate of $1.54. This figure represents a substantial 58.2% increase compared to 98 cents in the same quarter last year. Excluding the Bed Bath & Beyond lease acquisition, earnings were again reported at $1.55 per share, up from $1.10 in the prior year.
Check out the latest EPS estimates and surprises on Zacks Earnings Calendar.
Total sales reached $2,530.7 million, marking a 10.5% increase from the prior-year quarter, although this figure was short of the Zacks Consensus Estimate of $2,562 million. Comparable store sales grew by 1% year over year. The breakdown included net sales of $2,526.2 million and additional revenues of $4.5 million.
Analyzing BURL’s Margins
The gross margin for Burlington was 43.9%, which improved by 70 basis points from the same quarter last year. The merchandise margin increased by 50 basis points, supported by lower markdowns and higher markup. Year-over-year, freight expenses saw a 20 basis point improvement.
Adjusted selling, general, and administrative (SG&A) expenses climbed 9.2% year over year to $680 million. As a percentage of net sales, adjusted SG&A expenses stood at 26.9%, down 40 basis points from the prior year. Initially, an 11.7% growth in adjusted SG&A was anticipated for the quarter.
Product sourcing costs rose to $210 million from $200 million compared to the previous year.
Adjusted EBITDA grew 30.3% from the third quarter last year, reaching $228.8 million, with a margin increase of 140 basis points to 9.1%. Adjusted EBIT was $141.3 million, a 42.1% rise from $99.5 million in the year-ago quarter, leading to a 120 basis point improvement in the adjusted EBIT margin, which now stands at 5.6%.
Burlington’s Financial Position: Cash, Debt, and Equity Insights
At the close of the reported quarter, the company held cash and cash equivalents of $857.8 million, long-term debt of $1.54 billion, and stockholders’ equity of $1.15 billion. Burlington ended the fiscal third quarter with $1.71 billion in liquidity, which includes $858 million in unrestricted cash and $847 million available under its Asset-Based Lending (ABL) facility.
The total outstanding debt amounted to $1.71 billion, comprised of $1.24 billion from its term-loan facility and $453 million in convertible notes, with no borrowings under the ABL facility at this time.
The company repurchased 213,372 shares at a cost of $56 million during the fiscal third quarter. As of November 2, 2024, Burlington had $325 million remaining under its current share repurchase authorization.
Fourth Quarter and FY24 Forecast: What Lies Ahead for Burlington
Looking ahead to fiscal fourth quarter, Burlington predicts a total sales increase of 5-7%. This includes an expected comparable store sales growth of 0-2%. The adjusted EBIT margin is anticipated to improve by 50-80 basis points from the previous year.
The company forecasts adjusted earnings per share (EPS) to be between $3.55 and $3.75, compared to the previously reported $3.69 for the same period last year (this figure excludes $4 million in expenses related to the Bed Bath & Beyond lease acquisition).
For the fiscal year 2024, Burlington estimates total sales growth of 9-10%. Comparable store sales are expected to increase by 2-4%, bettering the previous guidance of 2-3%. This improvement signals a robust performance from individual stores. Additionally, the adjusted EBIT margin is forecasted to rise by 60-70 basis points, an upward adjustment from the earlier 50-70 basis point estimate.
The adjusted EPS target has been raised to a range of $7.76-$7.96, improving upon the prior estimate of $7.66-$7.96, reflecting better anticipated profitability. Both estimates exclude any costs related to the Bed Bath & Beyond leases.
Burlington plans for net capital expenditures of $750 million, aiming to open 101 new stores in fiscal 2024.
Over the last six months, this Zacks Rank #3 (Hold) stock has appreciated by 45.6%, compared to a 10.8% rise in the industry.
Alternatives for Consideration
Investors might also consider other well-ranked stocks such as Deckers Outdoor Corporation (DECK), The Gap, Inc. (GAP), and Gildan Activewear Inc. (GIL).
Deckers is renowned for its innovative footwear and accessories aimed at outdoor sports and other lifestyle applications. Presently, it has a Zacks Rank #1 (Strong Buy). The consensus for Deckers’ fiscal 2025 earnings and sales forecasts growth of 12.6% and 13.6%, respectively, from fiscal 2024 reported levels, with a 41.1% average earnings surprise over the last four quarters.
Gap, a global specialty retailer known for diverse clothing and accessories, currently holds a Zacks Rank #2 (Buy). The consensus estimate for Gap’s fiscal 2025 indicates anticipated growth of 37.8% in earnings and 1.3% in sales from fiscal 2024 figures, boasting a remarkable 101.2% average earnings surprise over the last four quarters.
Gildan specializes in premium quality branded activewear mainly sold in North America’s wholesale market and also carries a Zacks Rank #2.
The consensus estimate for Gildan’s current fiscal performance remains strong.
Gildan Activewear Reports Promising Earnings Growth
Strong Performance Signals Positive Trends
Gildan Activewear, Inc. (GIL) has announced its financial-year earnings and sales growth, showing increases of 15.6% and 1.5%, respectively, compared to 2023. Furthermore, the company boasts a trailing four-quarter average earnings surprise of 5.4%.
Stocks with Potential for High Returns
A Zacks expert has identified five stocks that could potentially double in value. Each stock has been singled out as a top pick for growth in 2024. While past recommendations have yielded impressive returns, including +143.0%, +175.9%, +498.3%, and +673.0%, it’s important to note not every pick will guarantee success.
Many of these stocks remain below Wall Street’s radar, representing an opportunity for investors to enter at an early stage.
Discover These 5 Potential Home Runs >>
Want the latest recommendations? Download 5 Stocks Set to Double for free.
Deckers Outdoor Corporation (DECK): Free Stock Analysis Report
The Gap, Inc. (GAP): Free Stock Analysis Report
Gildan Activewear, Inc. (GIL): Free Stock Analysis Report
Burlington Stores, Inc. (BURL): Free Stock Analysis Report
Visit Zacks Investment Research for more insights.
The views and opinions expressed herein are those of the author and do not necessarily reflect the views of Nasdaq, Inc.


