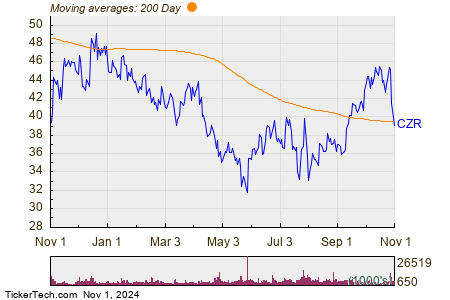
In Friday’s trading session, Caesars Entertainment Inc (Symbol: CZR) saw its stock price fall below the notable 200-day moving average of $39.58. During the day, shares hit a low of $39.18, reflecting a decline of approximately 2.1%.
The chart below illustrates the performance of CZR shares over the past year, alongside its 200-day moving average:

According to the chart, Caesars reached a low of $31.74 in the past 52 weeks, with its peak hitting $50.51. As of the last trade, CZR shares were priced at $39.22, highlighting a significant fluctuation within this timeframe. The moving average data is sourced from TechnicalAnalysisChannel.com.
![]() Click here to discover 9 other stocks that recently dropped below their 200-day moving average »
Click here to discover 9 other stocks that recently dropped below their 200-day moving average »
Related Insights:
- AQWA Average Annual Return
- CCTC Insider Buying
- HOV Market Cap History
The views and opinions expressed herein are solely those of the author and do not necessarily reflect those of Nasdaq, Inc.

