Carrier Global Corp Shares Fall Below 200-Day Moving Average
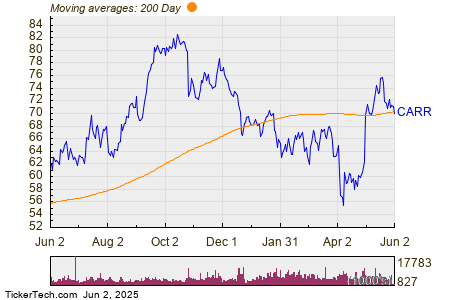
On Monday, Carrier Global Corp (Symbol: CARR) saw its shares dip below the 200-day moving average of $70.42, reaching a low of $69.31. Currently, CARR shares are down approximately 1.9% for the day.
The one-year performance chart for CARR illustrates that its 52-week low is $54.22, while its high is $83.32. The last recorded trade was at $70.21. Data regarding the 200-day moving average was sourced from TechnicalAnalysisChannel.com.

For further insights into dividend stocks, you may find additional information available on recent market movements.
The views expressed in this article are solely those of the author and do not necessarily represent those of Nasdaq, Inc.