This piece delves into the significant divergence between U.S. fiscal policy and U.S. monetary policy in the recent past, dissecting its distinct impacts on various sectors of the economy.
It also explores the notable divergence between the U.S., Europe, and China on these critical policies.
The Federal Reserve Versus the Treasury Department
Over the past several years, having a comprehensive macroeconomic framework has been crucial, but the ability to adjust and adapt within that framework has been equally vital. Some calls were spot on, some were far from it, but the key was being open to continuously revising the outlook based on evolving indicators in these tumultuous times.
From 2019 to 2022, I was bullish on inflation and bearish on bonds, especially emphasizing the potential emergence of fiscal-driven inflation. I delineated the shift from monetary supremacy to fiscal dominance. This forecast was right on the money. I outlined the scenario and its likelihood before it unfolded, and as inflation soared to levels not seen in four decades and triggered the worst bond bear market in modern history, I could closely track its timing and magnitude.
Up to now, central bank tools have primarily buoyed asset prices rather than the consumption of the middle class. By purchasing bonds, they injected money into the system but retained it on their balance sheets.
If central bank actions become more aggressive, converge with fiscal policies, and begin to focus on the middle class, they possess the potential to override various disinflationary pressures through sheer monetary expansion. They could issue helicopter money to alleviate debts, spur inflation, foster infrastructure development, rescue underfunded pension plans, and support the middle class, if policymakers opt for such measures.
The prospect of holding a 20-year or 30-year bond at exceptionally low fixed yields in such an environment doesn’t seem appealing. Negative yields would be even more precarious.
– Excerpt from “The Bond Market is Spookier Than the Stock Market,” July 2019
When total debt is high, interest rates hit the zero bound, and measured inflation is quite low, monetary policy loses its firepower. At that juncture, currency devaluation and direct fiscal expenditure, which the monetary authority acquires by augmenting the monetary base rather than the fiscal spending being procured from real private lenders, becomes a more potent stimulus tool. Fiscal spending usurps monetary policy and leads it. The 1940s and, so far, the 2020s were characterized by fiscal policy dominance in the United States.
– Extract from “A Century of Fiscal and Monetary Policy,” September 2020
Rapid expansions in the broad money supply that escalate demand for goods and services without a corresponding surge in the supply of goods and services trigger supply shocks and spur price inflation. With time, this price inflation becomes transitory in terms of rate of change, yet the prices ultimately stabilize at a higher level due to a permanent infusion of money into the system. This latter form of inflation is likely what we are witnessing at present.
– Segment from “Fiscal-Driven Inflation,” May 2021
However, by early-to-mid 2022, it became evident that the Fed was intent on staunchly combatting inflation, more so than I had anticipated. My perspective then shifted towards a cyclical phase of disinflation and a probable recession from that point, while reiterating the likelihood of multiple inflationary cycles in the overarching decade. Throughout history, most inflationary periods have comprised distinct waves of inflation and disinflation, and this time was shaping up to be no exception.
I initially anticipated that the peak in year-over-year inflation would occur in Q1 2023, with caveats regarding the right-tail risk stemming from potential oil shortages that could prolong this period. Russia’s invasion of Ukraine in late February 2022 indeed activated that very right-tail risk, thereby contributing to a peak in inflation a couple of months later in Q2 2023.
Due to baseline effects in the CPI calculation, there is a fair chance of observing a local apex in the official CPI sometime in Q1 2022 within the 7-9% year-over-year bracket.
– Excerpt from Stock Waves Report, December 12, 2021
The producer price index is indicating signs of hitting a high point in year-over-year terms. I believe we will likely see a similar trend for headline CPI by late Q1 or early Q2. I think there’s a good chance that year-over-year inflation will reach a local peak in a couple of months, and we will witness a phase of stagnant or lower year-over-year inflation figures for a while, albeit remaining above the target. The right-tail risk to this outlook is that if oil prices surge in the summer due to supply shortages and robust demand from emerging markets, it could result in higher-than-envisioned inflation (or more precisely, stagflation).
– Excerpt from Stock Waves Report, February 2, 2022
Overall, I continue to view the macro environment as being in a cyclically disinflationary period amidst an inflationary decade. Managing a portfolio hinges on one’s timeframe; assets expected to perform well over the next 5+ years could be weak over the next 6-12 months. When in doubt, I always adhere to my longer-run timeframe, although I strive to rebalance around the fringes counter-cyclically.
– Excerpt from Stock Waves Report, August 7, 2022
Aggregate consumer prices have surged by 19% since the start of 2020, which equates to four years ago. Under normal circumstances, where the Fed achieves its 2% annual inflation objective, the increase would have been around 8%. This sustained elevation in price levels is the reason why, despite a cooling down in inflation rate, many people still perceive the current inflation as lofty.
Back in May 2022, when interest rates were still below 1%, my article at that time was titled “Inflation Or Recession,” in which I presented a viewpoint that the Fed’s tightening would likely yield numerous outcomes:
The Fed can plausibly continue its tightening for a prolonged duration. However, if the Fed raises rates to 3%, 4%, 5%, and beyond when debt as a percentage of GDP is this high, the annual interest expense of the U.S. Treasury would surpass $1 trillion, precipitating challenges for many companies and households in refinancing their debts. Moreover, by persistently shrinking their balance sheet with QT, it will yield a negative impact on money creation and asset prices.
US Treasury and Fed Transform Financial Markets Amidst Tightening
The Initial Unfavorable Forecast
As the Fed continued to sharply raise rates, financial analysts predicted a series of troubling events.
Actual Market Transformation
Almost all the forecasted events came to pass initially. The Treasury’s annualized interest expense exceeded $1 trillion, exports stagnated, and the yield curve inverted. The full year 2022 proved challenging for most asset prices.
Surprising Resilience
Amidst the turmoil, large investment-grade companies and homeowner consumers demonstrated unexpected resilience due to their long-term fixed rate debts and cash-equivalents, which provided a cushion against the aggressive interest rate increases.
Impact on Different Sectors
However, small businesses, non-investment grade corporations, and commercial property developers faced liquidity challenges and refinancing difficulties due to their reliance on short-term loans and leverage.
Interventions and Fiscal Dominance
In a surprising turn of events, the U.S. Treasury Department stepped in to override the Fed, injecting liquidity into the financial system by drawing down the Treasury General Account amid a debt ceiling impasse in January-to-June 2023.
Fiscal Influence Amidst Monetary Tightening
Despite the Fed’s hawkish stance, increasing federal deficits inadvertently contributed to stimulating parts of the economy, counteracting some of the effects of the tightening monetary policy.
Current Market Liquidity
Market liquidity has remained relatively stable, with the Fed reducing its balance sheet and the Treasury General Account balances affected by the debt ceiling issue, leading to a sideways trend in liquidity, likely to continue for the near future.
Impact of Debt Ceiling Impasse Resolution
The resolution of the debt ceiling impasse in June 2023 led to the Treasury issuing an atypically large ratio of T-bills, reshaping the government debt issuance and influencing market liquidity.
Indicators of Recovery
Several indicators, such as the Fed’s reverse repo facility and commercial bank liquidity, point towards a recovery in market conditions, showcasing signs of resilience amidst economic challenges.
The Tug of War Between the U.S. Treasury and The Fed: A Liquidity Battle
Two of the most influential entities in the U.S., the Federal Reserve and the U.S. Treasury, have been operating contrary policies, effectively engaged in a tug of war. The Treasury has had to pull two different levers to keep up with the Fed.
From September 2022 through May 2023, the Treasury drained their own cash reserves back into the financial system, which offset the Fed. However, from June 2023 to the present, the Treasury rapidly increased their T-bill issuance as a percentage of their debt issuance, thus draining reverse repos back into the financial system, continuing to offset the Fed.
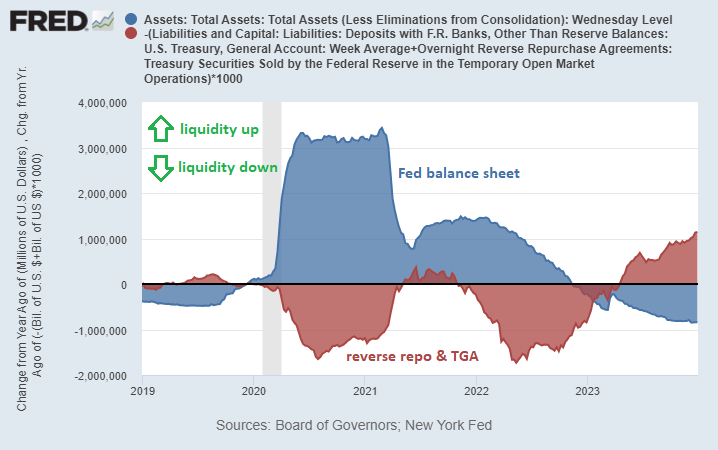
The net result is that domestic liquidity was decreasing until Q4 2022. However, it began to flatten out and turn slightly upward when the Treasury began its inverse operation.
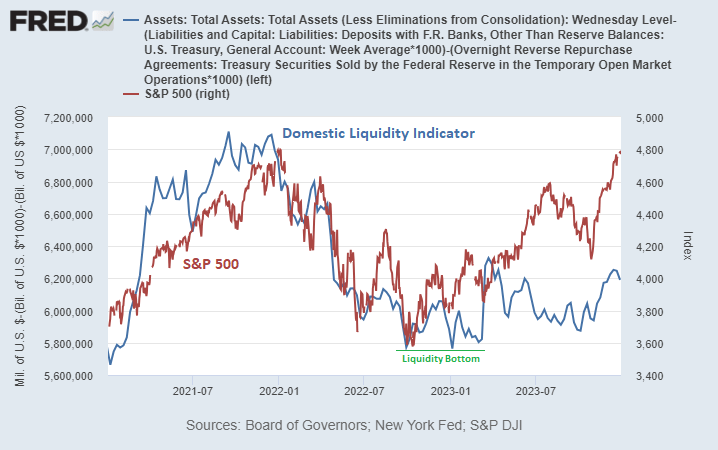
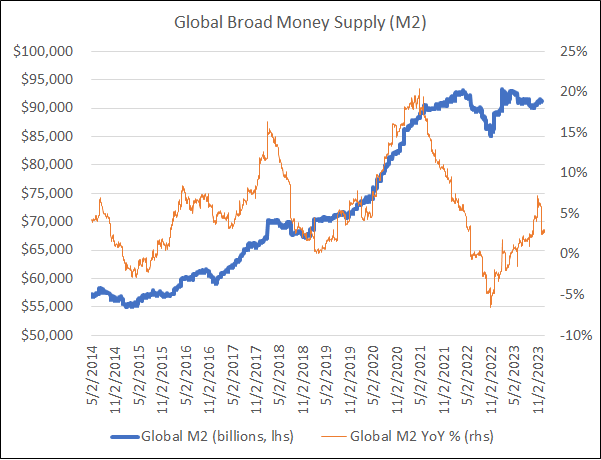
For global liquidity indicators, the bottom also occurred in Q4 2022 and has been flat-to-up ever since. The global broad money supply of major currency blocs, denominated in dollars, serves as a preferred metric for global liquidity.
Summing Up This Section
From 2020 through 2021, fiscal and monetary stimulus, coupled with supply chain disruptions in response to the pandemic lockdowns, caused a surge in most asset prices and then a surge in consumer prices. In contrast, from early 2022 to the present, the Fed has been trying to reduce inflation by tightening monetary policy as much as possible.
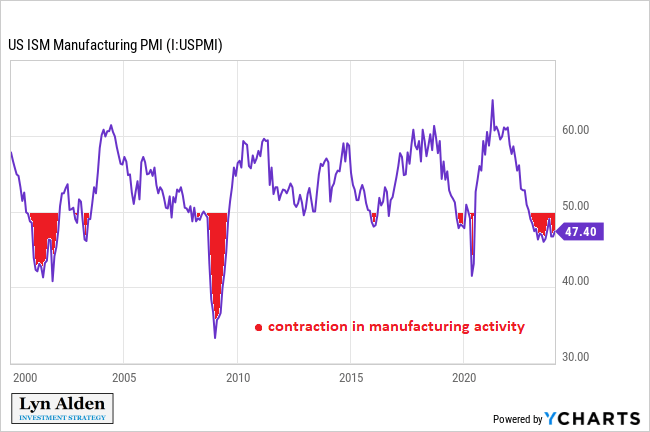
Liquidity Leads the Economy
When the Fed or Treasury perform actions that affect overall financial liquidity, it impacts financial markets first and foremost, but it also impacts the real economy to a certain extent. This can be observed in U.S. manufacturing activity, which was decelerating throughout 2022, entering mild contraction but has been trying to stabilize in 2023.
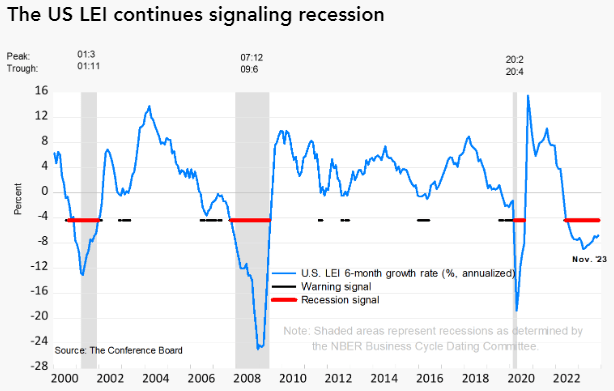
The same is true for the Conference Board’s broad set of leading indicators, reflecting the impact of economic liquidity changes.
It is widely acknowledged that equity prices affect economic performance heavily. In the U.S., the wealthiest top 1% hold 32% of total net worth. Any fluctuation in equity value matters greatly for this segment of the population, influencing their spending, investing, tax payments, and other financial activities.
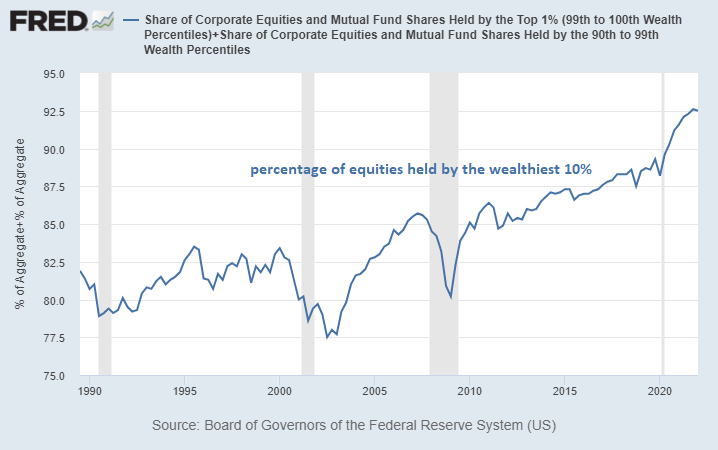
Moreover, a large portion of wealthy peoples’ net worth is subject to changes in equity prices. For many of them, their annual income is also highly tied to equity performance. Across the board among the top percentile of earners in the U.S., equity compensation is quite high. Over 70% of S&P 500 CEO compensation is in the form of stock rewards and stock options.
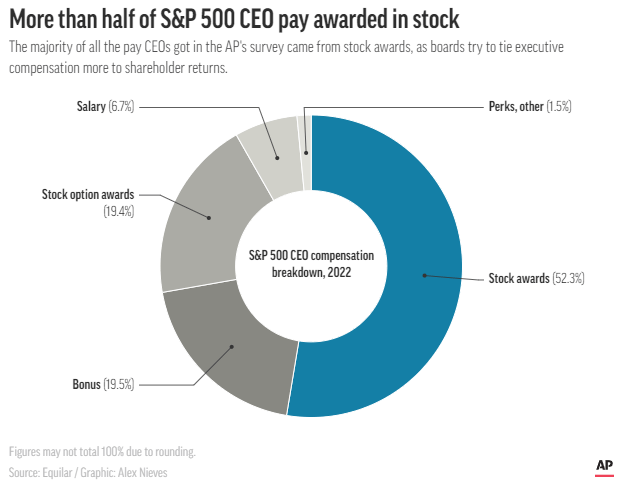
The numbers are a bit lower for non-CEO executives at large companies and even lower for CEOs and executives at smaller companies, but the overall percentage of equity compensation is substantial. Fund managers’ compensation is often tied to equity performance as well, via carried interest.
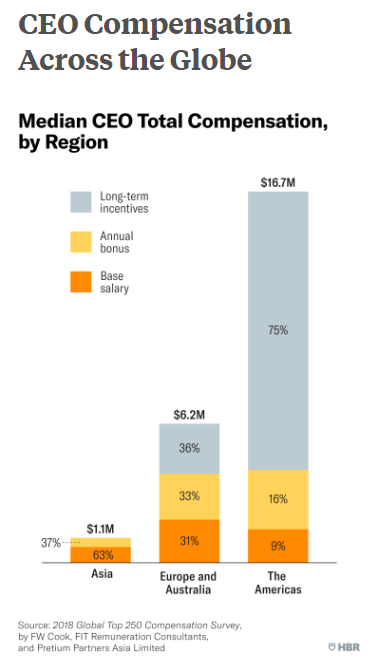
In contrast, corporate executives in Europe and Asia are not generally compensated like their American counterparts.
Implications of Global Economic Dynamics on Financial Markets
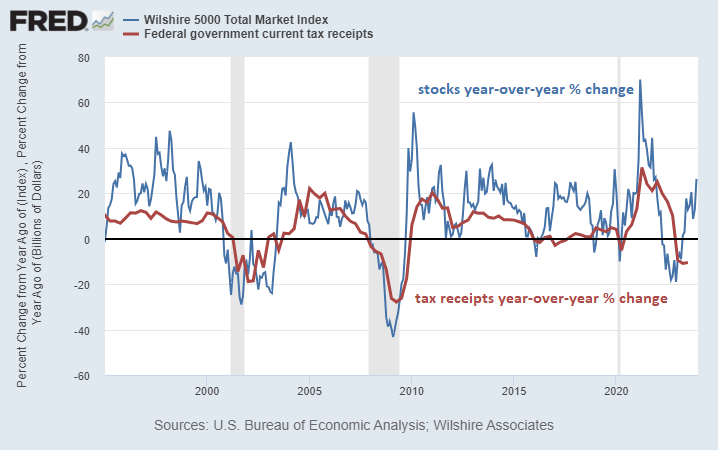
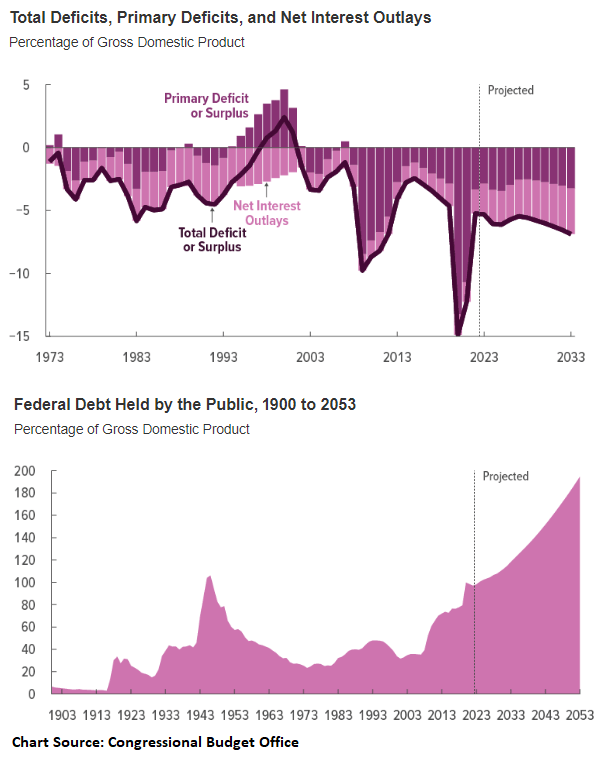
The performance of U.S. tax receipts is significantly linked to year-over-year stock performance, reinforcing a cyclical relationship between equity prices and fiscal deficits.
This symbiotic connection serves as a financial seesaw; as equity prices decline or remain stagnant, fiscal deficits swell, subsequently injecting vigor into the equity market and the broader economy, ultimately buttressing equity prices or at the very least, stemming their descent more effectively than anticipated.
The amplification of this feedback loop over time is propelled by burgeoning debts and deficits, alongside the expansion of the stock market relative to GDP. Three decades ago, the U.S. stock market represented approximately 70% of U.S. GDP, a figure that has surged to approximately 170% today.
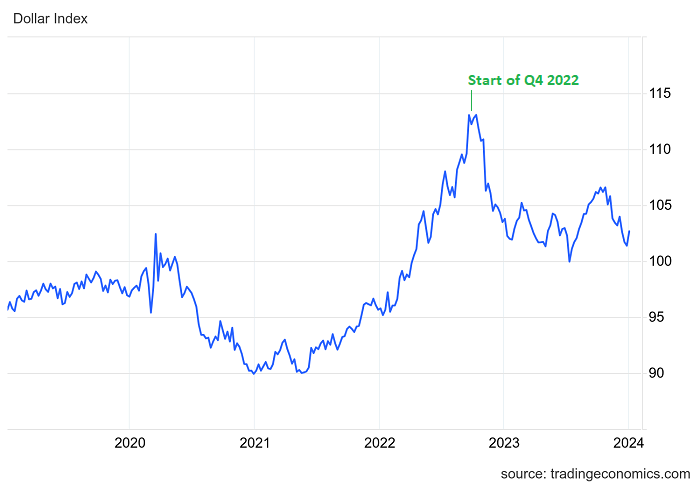
Furthermore, there exists a colossal $13 trillion in dollar-denominated debt outside of the United States, primarily owed to non-U.S. creditors. The fluctuation of the dollar against other currencies significantly impacts the financial conditions of these creditors, subsequently exerting a dampening or invigorating impact on their respective economies. This global interconnectivity cascades back into the U.S. economy through various channels.
Global Economic Blocs in Contrast
Throughout 2023, the economic policies and outcomes of major global blocs have diverged markedly from one another.
For instance, the United States adopted a loose fiscal policy characterized by substantial deficits but countered this with tight monetary policy, exemplified by escalating interest rates. In stark contrast, China pursued a tighter fiscal policy, featuring smaller deficits, while concurrently implementing a loose monetary policy typified by interest rate reductions.
The disparities in the potency of fiscal policy vis-à-vis monetary policy have come to the fore. The divergence in economic performance between the U.S. and Chinese economies in the past year underscores this discrepancy.
The European bloc has borne the brunt of the economic tumult, grappling with austere fiscal policy, constricted monetary policy, and soaring energy expenses. By decommissioning functional nuclear plants and heavily relying on Russian gas, the region left itself exposed to external energy shocks, which materialized following Russia’s incursion into Ukraine. Moreover, the migration of energy-intensive sectors from Germany to countries like China and the United States has exacerbated the continent’s economic woes.
- The United States displays feeble production but robust consumption.
- The Euro Area manifests feeble production and consumption.
- China showcases robust production but feeble consumption.
Collective Monetary and Fiscal Policy Impact
The centralized forces of monetary and fiscal policy exert a momentous influence not only on financial markets but also on economic performance.
Especially in recent years, with burgeoning fiscal debts, persistent deficits, and frequent usage of unconventional monetary policy, these forces, alongside their effect on liquidity, emerge as major catalysts for financial markets and the economy at large.
In the United States, from 1980 to 2007, monetary policy wielded greater sway than fiscal policy. Subsequently, from 2008 to 2019, both fiscal and monetary policy substantively impacted markets and the economy. Looking ahead, fiscal dominance is expected to persist throughout the 2020s and into the 2030s, owing to the sustained structural deficits in absolute terms and as a percentage of GDP.
The outlook for the 2020s decade entails a scenario where U.S. nominal GDP surpasses expectations, real assets on a global scale perform admirably (e.g., energy, infrastructure, commodities, hard monies, and select emerging market equity regions), while more financialized assets such as the S&P 500 deliver lackluster performance in real terms.
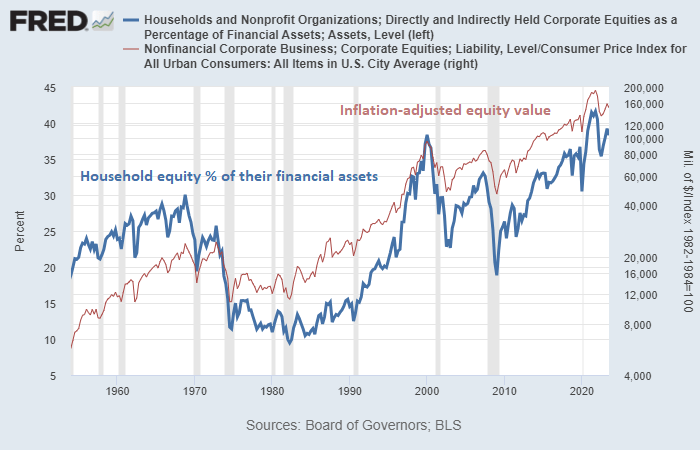
High equity valuations, elevated U.S. household allocations to equities in relation to their net worth, and substantial foreign investment in U.S. markets collectively pose formidable challenges in attracting fresh capital to U.S. equity markets.
The correlation between the percentage of financial assets held by U.S. households in stocks and the inflation-adjusted value of equities vividly illustrates this challenge.
Parting Words
In the realm of financial analysis, a major limitation for many analysts and investors is rigid thinking.
Adhering dogmatically to specific viewpoints often leads to being astoundingly accurate for a cycle but overstaying that success and subsequently enduring significant setbacks in the subsequent cycle.
Historical patterns echo, but they do not unfold identically. Macroeconomic cycles typically evolve over a longer timeframe than expected. Regardless of the multitude of variables factored into an analysis, there inevitably exist unaccounted factors. Hence, a dynamic framework coupled with a constant reassessment of the prevailing landscape, along with the incorporation of new information, is indispensable for sound investing and analysis.