Garmin’s Strong Q4 Results Drive Stock Surge to New Heights
Garmin (NYSE: GRMN), widely recognized for its GPS technology, recently reported its Q4 earnings, revealing a profit of $2.41 per share on sales totaling $1.82 billion. These results exceeded analysts’ estimates of $2.05 per share and $1.7 billion in revenue. Following this positive news, Garmin’s stock price soared to around $240, marking an all-time high.
Since the start of 2024, GRMN shares have gained 91%, significantly outperforming the S&P 500 index, which has risen by 28%. This profitability surge reflects well on Garmin’s stock performance. For investors seeking a steadier investment route, the High-Quality Portfolio, boasting over 91% returns since its launch, may represent a smart alternative.

Image by Mario from Pixabay
Wearable Tech Drives 23% Revenue Surge
Garmin’s revenue reached $1.82 billion in Q4, representing a 23% year-over-year increase. The Fitness segment excelled with a 31% revenue boost to $539 million, fueled by strong sales of wearable devices like the newly released Lily 2 Active GPS watch. Meanwhile, the Outdoor segment saw sales rise 29% to $629 million, aided by new product launches including the Fenix 8 and Enduro 3.
In other areas, Aviation revenue climbed 9% to $237 million, thanks to partnerships for the G3000 avionics system. Marine sales grew modestly by 5% to $251 million, and Auto OEM revenue surged by 30% to $166 million, driven by the adoption of Garmin’s Unified Cabin domain controller.
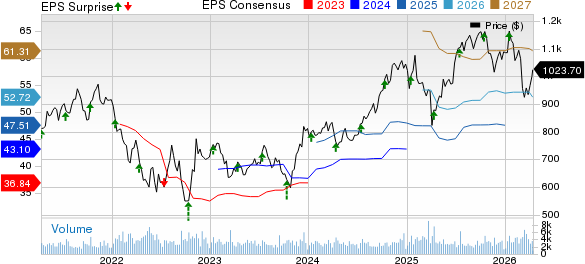
Strong Margins Lead to 40% Earnings Growth
Garmin’s Q4 performance displayed strong improvements across key financial metrics. The company’s operating margin expanded significantly, rising by 530 basis points to 28.3%. This margin growth, combined with increased sales, resulted in a 40% year-over-year jump in earnings per share, reaching $2.41.
Optimistic Revenue Growth Expectations for 2025
Looking forward to 2025, Garmin is optimistic about its growth potential, projecting a revenue of $6.8 billion, which indicates an 8% growth. It also expects adjusted earnings per share of $7.80, reflecting a 6% increase from the previous year. These estimates slightly surpass Wall Street’s expectations of $6.7 billion in revenue and $7.77 in earnings per share.
GRMN Stock: Assessing Your Risk Tolerance
After announcing Q4 results, GRMN stock jumped by 13%. However, this stock has a history of volatility. Over the past four years, its performance varied greatly, with annual returns of 15% in 2021, -30% in 2022, 43% in 2023, and 63% in 2024.
In comparison, the Trefis High Quality (HQ) Portfolio, consisting of 30 stocks, has shown far less volatility while outperforming the S&P 500 index during the same period. The HQ Portfolio aims to provide superior returns with lower risk, evident in its consistent performance metrics.
Should You Invest in GRMN Stock at $240?
With the current unpredictable macroeconomic climate, marked by interest rate changes and trade conflicts, will GRMN face challenges similar to 2021 and 2022, potentially hindering its performance over the next year? At present, GRMN appears to be fully valued based on its earnings.
Trading near $240, GRMN stock carries a price-to-earnings ratio of 33x based on trailing earnings of $7.39 per share, roughly 50% higher than its average P/E ratio of 22x over the last five years. While Garmin’s solid Q4 results and promising outlook for 2025 support some recent valuation increases, potential investors may want to wait for a price decrease for better entry points.
Although GRMN stock currently seems fairly priced, analyzing Garmin’s peers based on key metrics can provide insightful comparisons. Explore more Peer Comparisons across various industries.
| Returns | Feb 2025 MTD [1] |
Since start of 2024 [1] |
2017-25 Total [2] |
| GRMN Return | 12% | 91% | 515% |
| S&P 500 Return | 1% | 28% | 173% |
| Trefis Reinforced Value Portfolio | -2% | 20% | 716% |
[1] Returns as of 2/20/2025
[2] Cumulative total returns since the end of 2016
Invest with Trefis for Market Beating Portfolios.
For more insights, see Trefis Price Estimates.
The views and opinions expressed herein are the views and opinions of the author and do not necessarily reflect those of Nasdaq, Inc.