Decoding the Saylor-Buffett Ratio: What It Means for Today’s Market
Warren Buffett and Michael Saylor are iconic figures in the investing landscape. Buffett has been at the helm of Berkshire Hathaway (NYSE: BRK.A)(NYSE: BRK.B) for decades, earning a reputation as one of the best investors of all time.
Inside Berkshire, Buffett oversees a massive equities portfolio worth over $300 billion, where he and his team buy and sell stocks, often focusing on traditional value investing techniques.
Where should you invest $1,000 today? Our analysts have just shared their picks for the 10 best stocks to consider now. Check out the stocks »
On the other side, Michael Saylor has been a fixture in Silicon Valley since the early 1990s, leading MicroStrategy (NASDAQ: MSTR). In a pivotal shift in 2020, the company began accumulating large amounts of Bitcoin, the most prominent cryptocurrency.
Despite their vastly different approaches to wealth accumulation—Buffett’s traditional methods versus Saylor’s cryptocurrency investment—investors are tracking a ratio that links their companies. Recently, that ratio reached a level not seen in almost 25 years.
Are we on the verge of a significant market shift? Let’s delve deeper.
Understanding Market Sentiment Through the Saylor-Buffett Ratio
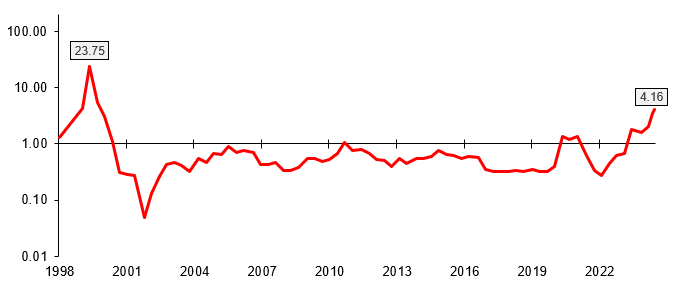
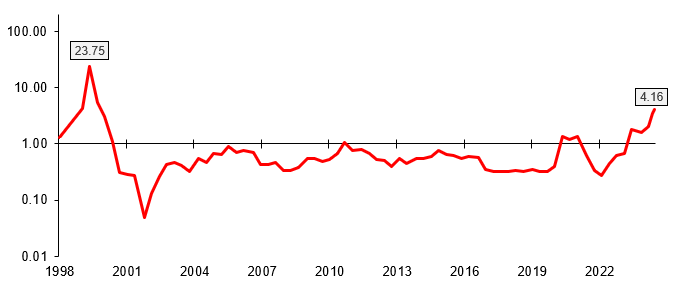
Owen Lamont, a former Ivy League finance professor now working at Acadian Asset Management, introduced the Saylor-Buffett ratio. This compares the cumulative returns from MicroStrategy’s stock against the cumulative returns from Berkshire Hathaway Class B shares, starting from June 1998.
Lamont views Buffett and Berkshire as representatives of traditional investing, while Saylor and MicroStrategy heavily lean toward the ownership of Bitcoin, known for its price volatility that has often resulted in significant gains.
Despite embracing Bitcoin relatively recently, Saylor’s previous investments in internet and technology stocks during the ’90s show his inclination toward innovation long before it became mainstream. Lamont believes this ratio can serve as an indicator of “speculative excess” in the market, helping to signify when investors might be inflating prices into bubble territory.
It’s important to note that Lamont sees the Saylor-Buffett ratio as imperfect. While various financial metrics can signal market conditions, this particular ratio has effectively highlighted previous market bubbles.

Chart by author; Data: Wise Sheets.
A higher Saylor-Buffett ratio indicates that MicroStrategy’s returns are outpacing those of Berkshire, reflecting heightened investor confidence in more speculative assets. This ratio recently reached levels reminiscent of early 2000, just before the dot-com bubble burst (data as of December 18). This trend aligns with Bitcoin surpassing $107,000, coupled with a surge in high-performing artificial intelligence stocks that have driven much of this year’s market gains.
What Does This Mean for Investors?
As Lamont himself cautioned, the ratio is not a precise scientific measure. Observers of market trends may notice various other indicators suggesting overvaluation, and cautioning against a potential U.S. recession. The broader benchmark S&P 500 has increased over 50% in the past two years— a significant warning signal.
Nonetheless, trends from the past do not always predict the future. Currently, the Saylor-Buffett ratio stands lower than it did prior to the dot-com crash. The market showcased strong growth in the ’90s leading into that crash, raising questions about whether this bull market may continue or if a downturn may be on the horizon.
Timing market movements is notoriously challenging. Many patterns from previous bubbles or recessions often appear differently than before, making detection difficult. That said, recognizing that the market may be overvalued in several aspects allows investors to prepare for potential adjustments.
If you adopt a long-term investment strategy of five to ten years, significant changes to your portfolio may not be necessary. Historically, markets rebound from corrections and crashes, though at varying speeds. Being informed and ready can better position you to navigate any downturns, whether by making slight adjustments to your holdings or remaining calm during volatility.
Is Now the Right Time to Invest $1,000 in Berkshire Hathaway?
Before deciding to buy Berkshire Hathaway shares, consider this:
The Motley Fool Stock Advisor team has recently identified what they believe are the 10 best stocks to invest in right now… and Berkshire Hathaway isn’t included among them. The featured stocks could yield substantial returns in the coming years.
For perspective, when Nvidia made the list on April 15, 2005, a $1,000 investment from that time would be worth $825,513!*
Stock Advisor offers an accessible path to investing success, providing portfolio-building tips, regular analyst updates, and two fresh stock picks each month. Since 2002, this service has outpaced the S&P 500’s returns more than fourfold.
Check out the 10 stocks »
*Stock Advisor returns as of December 16, 2024
Bram Berkowitz holds positions in Bitcoin. The Motley Fool has positions in and recommends Berkshire Hathaway and Bitcoin. The Motley Fool has a disclosure policy.
The views and opinions expressed herein are the views and opinions of the author and do not necessarily reflect those of Nasdaq, Inc.


