Investing Trends: S&P 500 on a Winning Streak
The S&P 500 (SNPINDEX: ^GSPC) has achieved a remarkable gain of 28% in 2024, following a strong return of 26% in 2023.
Historically, back-to-back annual gains of over 25% have only occurred once since the S&P 500 was established in 1957. The index experienced a 33% rise in 1997, followed by an impressive 29% gain in 1998, largely driven by the dot-com bubble that inflated stock valuations significantly.
How History Might Influence Future Returns
In 1999, the S&P 500 soared by an additional 21%, furthering its gains from the previous years. While this suggests the possibility of another strong year in 2025, history is not always a reliable guide.
The excessive enthusiasm of the dot-com boom, when investors poured money into internet companies without revenue or solid business plans, differs greatly from today’s market. A cautionary tale from that era is Pets.com, which raised $82.5 million in its 2000 IPO but filed for bankruptcy just nine months later.
Today’s stock market, however, is more stable. Companies like Nvidia are leading the charge in artificial intelligence (AI) and generating substantial revenue. According to Wall Street’s average forecast (provided by Yahoo!), Nvidia is projected to reach $129 billion in revenue for fiscal 2025, reflecting a significant increase of 111% year over year.
Therefore, while predicting the end of a speculative phase like the dot-com bubble is challenging, the S&P could still show positive returns next year due to robust growth from major companies within the index.
Market Valuations and Future Prospects
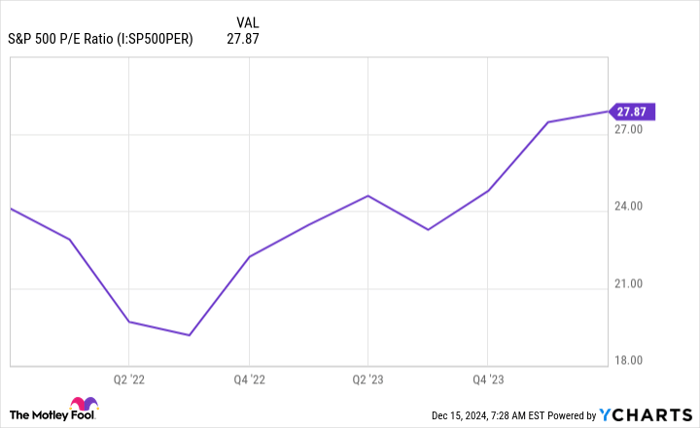
After two strong years, skepticism arises regarding the S&P 500’s ability to maintain momentum. Currently, the index has a price-to-earnings ratio (P/E) of 27.9, which stands at a 54% premium compared to its long-term average of 18.1.

S&P 500 P/E ratio; data by YCharts.
It’s essential to keep in mind that P/E ratios are not foolproof indicators of when to buy or sell assets. For instance, in 1999, the S&P 500’s P/E ratio reached 34, indicating that the index continued to grow despite being overvalued. This eventual crash from 2000 to 2002 serves as a reminder that markets can remain inflated for longer than anticipated.
Consequently, selling stocks solely based on high valuations may not be prudent. Factors such as strong corporate earnings and other growth drivers could help sustain the market.
The U.S. Federal Reserve’s decision to cut interest rates is another important factor. Lower interest rates reduce yields for safer assets, making stocks more appealing, even at high valuations. Additionally, reduced borrowing costs encourage companies to invest in growth, further enhancing earnings potential.
Moreover, AI remains a critical growth driver for the largest companies in the S&P. A report from Morgan Stanley indicates that four major players – Microsoft, Amazon, Alphabet, and Meta Platforms – plan to invest a combined $300 billion in AI infrastructure during 2025. This spending not only targets long-term gains but boosts suppliers like Nvidia, Advanced Micro Devices, and Broadcom in the shorter term, potentially lifting the S&P 500 further.

Image source: Getty Images.
Potential Volatility on the Horizon
As we look ahead, political changes may induce market volatility. The upcoming Trump administration is expected to implement economic policies that deviate significantly from those of the Biden administration, which could lead to short-term adjustments in the market.
During Trump’s previous term, tariffs on steel and aluminum generated fears of a trade war, almost pushing the S&P 500 into a bear market in 2018. Given that tariffs are again likely to be on the agenda, a temporary dip in the S&P after January 20 may not be unexpected. However, this shift could also present a buying opportunity for long-term investors if valuations drop.
Seize the Opportunity Before It’s Gone
If you think you’ve missed out on some of the top-performing stocks, now might be the perfect moment to reconsider.
Our expert analysts occasionally issue a special “Double Down” stock recommendation for companies poised for a potential surge. If you’re worried about having missed your chance to invest, acting soon could lead to significant rewards, as historical data reflects:
- Nvidia: If you invested $1,000 when we doubled down in 2009, you’d have $342,278!
- Apple: If you invested $1,000 when we doubled down in 2008, you’d have $47,543!
- Netflix: If you invested $1,000 when we doubled down in 2004, you’d have $496,731!
We are currently issuing “Double Down” alerts for three remarkable companies, making this a crucial moment for potential investors.
See 3 “Double Down” stocks »
*Stock Advisor returns as of December 16, 2024
John Mackey, former CEO of Whole Foods Market, an Amazon subsidiary, is a member of The Motley Fool’s board of directors. Suzanne Frey, an executive at Alphabet, is a member of The Motley Fool’s board of directors. Randi Zuckerberg, a former director of market development and spokeswoman for Facebook and sister to Meta Platforms CEO Mark Zuckerberg, is a member of The Motley Fool’s board of directors. Anthony Di Pizio has no position in any of the stocks mentioned. The Motley Fool has positions in and recommends Advanced Micro Devices, Alphabet, Amazon, Meta Platforms, Microsoft, and Nvidia. The Motley Fool recommends Broadcom and recommends the following options: long January 2026 $395 calls on Microsoft and short January 2026 $405 calls on Microsoft. The Motley Fool has a disclosure policy.
The views and opinions expressed herein are those of the author and do not necessarily reflect those of Nasdaq, Inc.


