The iShares MSCI India ETF (Symbol: INDA) experienced a notable outflow this week of approximately $284.3 million, marking a 2.8% decrease in shares outstanding from 189,700,000 to 184,300,000. This change stands out among the ETFs surveyed by ETF Channel.
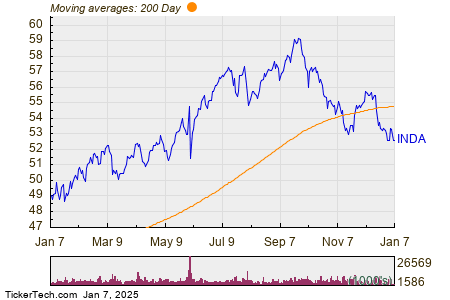
The chart below illustrates the one-year price performance of INDA compared to its 200-day moving average:

According to the chart, INDA has a 52-week range with a low of $48.56 per share and a high of $59.49. The most recent trading price is $52.67. Comparing the current share price to the 200-day moving average is an effective technique for technical analysis.
Exchange-traded funds (ETFs) operate similarly to stocks; however, investors trade “units” instead of shares. These units can be bought and sold just like stocks, but they can also be created or destroyed according to demand. We analyze weekly changes in shares outstanding to identify ETFs experiencing significant inflows (indicating new units created) or outflows (indicating old units destroyed). When new units are created, the ETF purchases its underlying holdings, while destruction of units involves selling these holdings. Consequently, large inflows or outflows can significantly affect the components within ETFs.
![]()
Click here to find out which 9 other ETFs experienced notable outflows »
Additional Resources:
- Auto Dealerships Dividend Stocks
- Funds Holding CXDC
- LPLA Market Cap History
The views and opinions expressed herein are those of the author and do not necessarily reflect those of Nasdaq, Inc.

