Trump’s Tariff Increase Triggers Stock Market Reaction Amid Uncertainty
This morning, President Trump escalated the tariff conflict, imposing an additional 25% tariff on Canadian steel and aluminum. This raises the total duty to 50% on these imports.
The new tariffs take effect tomorrow morning.
Here is Trump’s explanation on Truth Social:
Due to Ontario, Canada, imposing a 25% tariff on “Electricity” entering the United States, I have directed my Secretary of Commerce to raise tariffs by an ADDITIONAL 25%, totaling 50%, on all STEEL and ALUMINUM from CANADA, one of the highest tariffed nations worldwide.
In retaliation, Ontario Premier Doug Ford threatened to cut off electricity to U.S. customers.
This illustrates the nature of trade wars.
Prior to this morning’s announcement, stocks were attempting to stabilize. After 30 minutes of trading, the S&P 500 was flat, the Dow Jones Industrial Average showed minor declines, and the Nasdaq Composite was up about 0.70%.
However, just minutes after Trump’s announcement, all three major indexes dipped into negative territory. At the time of writing, the Nasdaq has regained a slight advantage. The uncertainty surrounding today’s closing remains.
Let us step back to assess this volatility.
What is the potential for a market bounce? What would the impact be if the downturn continues? And how do our experts view this pullback overall?
Are We Approaching Technical Exhaustion?
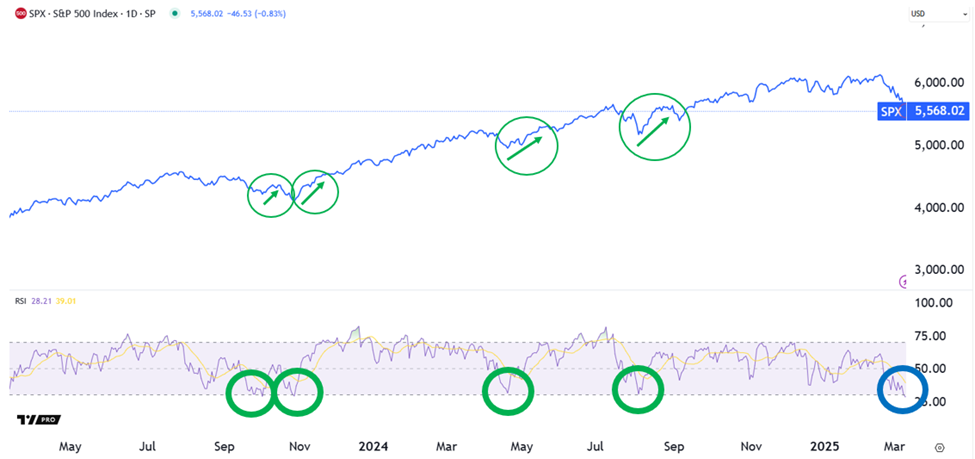
To start, let’s analyze the S&P 500’s Relative Strength Index (RSI) indicator.
For newer Digest readers, the RSI is a momentum tool that evaluates if an asset is overbought or oversold.
An RSI reading above 70 implies that an asset is “overbought” (and likely to pull back), while a reading below 30 indicates it is “oversold” (and could rise as value-seeking traders jump in).
As of today, the S&P’s RSI stands at 28 — officially marking it as “oversold.”
As you’ll see below, this level has been reached four times in the past two years. In each instance, stocks rose in the following days, though the duration of the rally varied.

Source: TradingView
While this does not assure a market bounce, it does improve the odds.
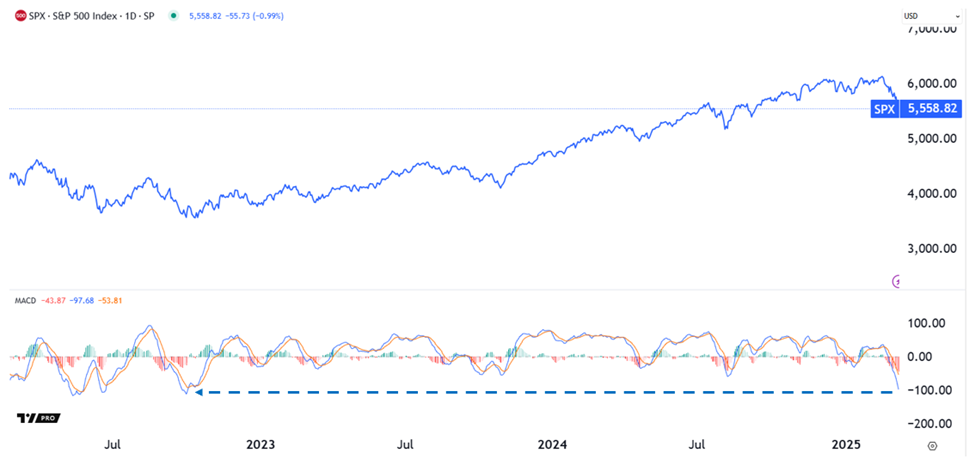
We find a similar perspective in the S&P’s Moving Average Convergence/Divergence (MACD) indicator. This indicator shows alterations in the momentum, strength, direction, and duration of price trends.
Currently, it is at its lowest level since the bear market low of 2022.
Source: TradingView
Such extremes usually do not persist.
Think of it like a rubber band: as the MACD and RSI stretch, the potential for a rapid snapback rally increases when the pressure eventually eases.
If a recovery rally is forthcoming, how much could we ascend?
The Case for an 8%+ Bounce
To inform this analysis, we turn to seasoned trader Jeff Clark.
For newcomers, Jeff boasts over 40 years of market experience and has a proven ability to profit from market movements, whether they rise, fall, or remain sideways, through his service Jeff Clark Trader.
In recent days, one of Jeff’s indicators has issued a “bull” signal. Here’s what he shared this past Friday:
The Volatility Index (VIX) just generated its third broad stock market “buy signal” for 2025, all occurring within the span of the last 10 days.
The first two signals reversed immediately. Bullish traders are hoping this third signal proves successful.
VIX buy signals happen when the index closes above its upper Bollinger Band and then back inside.
While the track record of this indicator is strong, it is not infallible. It is possible for the stock market to drop post-trigger, causing the VIX to again exceed its upper Bollinger Band, voiding the buy signal.
Jeff highlights a rare occurrence of two consecutive failed VIX buy signals, which sets the stage for a potential “triple” buy signal:
When this occurs, it typically leads to “V” shaped rallies.
For instance, last July/August, we experienced three VIX buy signals in a two-week timeframe, of which the first two did not hold.
However, after the third signal, the S&P 500 rallied 400 points (8%) in approximately ten days.
Market Analysis: Nasdaq-100’s Stability and Potential Growth Ahead
A similar move this time around would have the S&P 500 challenging the top of its recent trading range – near 6100 – by St. Patrick’s Day.
Luke Lango: Assessing Nasdaq-100’s Current Landscape
Market analyst Luke Lango recently conducted a study that points to a potentially bullish trajectory for the Nasdaq-100. Given the tech-centric nature of today’s economy, this index comprises the world’s 100 largest technology companies, making it a key focus for investors.
In his analysis, Luke examined historical data related to the Nasdaq-100’s performance after it fell below its 200-day moving average (MA). Earlier this week marked the first instance in over a year that the index closed beneath this critical threshold.
Here are Luke’s insights:
[The Nasdaq-100] has crossed below its 200-day moving average precisely 11 times before since 1990. All 11 times, the market was either on the cusp of a significant rebound or a major breakdown, depending on its behavior in the following two weeks.
According to Luke, if the Nasdaq-100 can maintain itself within 4% of its 200-day MA, stocks have consistently rebounded over the next year, yielding average gains exceeding 25%. In light of this, he issued five “buy” alerts through his service, Innovation Investor, yesterday.
From Luke:
We view the odds of an economic recovery as significantly greater than the odds of an economic recession. Therefore, we believe the potential for stocks to soar over the next year is much higher than the risk of a market crash.
So… let’s get aggressive here.
Many regular readers of the Digest would recognize a quote from billionaire Rob Arnott, founder and chairman of Research Affiliates:
In investing, what is comfortable is rarely profitable.
What If Nasdaq-100 Slides Further Below 200-Day MA?
Conversely, there exists a downside risk if the Nasdaq-100 fails to rebound. Referring back to Luke’s analysis, he notes:
[In our case study analysis,] if the Nasdaq-100 didn’t maintain strong defense and fell more than 4% beneath its 200-day moving average within the next two weeks, stocks have always slumped into a bear market.
This scenario unfolded in early 1990 (before the ’90s recession), mid-2000 (prior to the dot-com crash), early 2008 (before the 2008 financial crisis), and early 2022 (ahead of the inflation crash).
Currently, the 200-day MA stands at 20,323, while the index trades at 19,452, indicating that it is slightly more than 4% lower. The market is precariously holding its ground, and a bullish trend is needed soon.
Maintaining Perspective Amidst Market Volatility
While InvestorPlace’s analysts are cautious, they are also identifying opportunities in the current environment. Luke’s recent five-stock recommendation demonstrates his commitment to identifying value. Additionally, global macro expert Eric Fry recently made a recommendation, suggesting that today’s purchases may not yield immediate satisfaction but could pay off significantly in the long run.
Moreover, legendary investor Louis Navellier is also gearing up for a live event Thursday at 1 p.m. Eastern, focusing on Nvidia Corp.’s upcoming annual conference. He anticipates that Nvidia will unveil technology that could substantially impact its smaller partners.
Here is Louis explaining further:
In the third week of March, the big NVIDIA Corporation annual conference will occur. I expect Nvidia to announce a breakthrough technology that could ignite interest in one of its smaller partners—a stock I consider top-rated in the quantum sector.
This recent market pullback may present an enticing opportunity for those looking to invest strategically.
A Broader Market Perspective
InvestorPlace’s CEO, Brian Hunt, emphasizes the importance of a long-term view during market downturns. His insights are crucial for investors, especially during periods of falling stock values.
In an essay from last year, he highlighted essential principles for managing emotions amidst market instability. His perspective is particularly relevant as it encourages investors to focus on progress, innovation, and long-term gains rather than getting anxious during temporary drops.
Brian reminds us:
Even in a modest 15% market drop, emotions can affect decision-making. It’s vital to remember the significant benefits of investing in innovative companies, as history shows that such stocks have generated substantial wealth over time.
Our “bear market survival” plan revolves around embracing the long-term strength of the stock market, focusing on high-quality investments, and avoiding panic selling.
Have a good evening,
Jeff Remsburg