Ford Motor Co. Struggles Yet Remains Committed to EV Growth
Ford Motor Co. (NYSE: F) ranks as the second-largest automaker in the United States, following General Motors Inc. (NYSE: GM). While the company is starting to recover with improved inventory levels stemming from easing supply chain issues in 2024, its stock continues to lag, trading down 16%. Over the past decade, Ford’s stock has produced a meager 10% return, especially when compared to the S&P 500 index, which has seen 250% cumulative gains. Notably, Ford faced 62 recalls in 2024, doubling the number of recalls announced by GM.
Ford Stands Firm on EV Plans Despite Heavy Financial Losses
Ford’s shift towards the electric vehicle (EV) sector has proven to be costly, as Tesla Inc. (NASDAQ: TSLA) and Rivian Motor Inc. (NASDAQ: RIVN) have outperformed it. Nonetheless, Ford anticipates benefiting from Trump’s proposed 25% tariffs on imports. Even with projected annual losses of $1.5 billion in its EV segment, the company remains resolute in its EV strategy.
CEO Jim Farley emphasized the company’s commitment, stating, “Since Q1 of last year, EV volumes have grown 35%, while total revenues remain flat at $14 billion. That suggests that price increases have offset our volume gains. We expect about 150 new EV models to launch in North America by the end of 2026. Some competitors are resorting to aggressive leasing tactics for new products, creating significant residual risk and potential brand damage.”
Encouraging Q3 Performance and Growth in Ford Pro
In the third quarter of 2024, Ford reported earnings per share (EPS) of 49 cents, outpacing analyst expectations of 46 cents by 3 cents. Year-over-year (YoY), revenues increased by 5.5% to $46.2 billion, surpassing the consensus estimate of $45.13 billion. In North America, volume grew by 8% YoY, bolstered by new trucks and SUVs, which helped Ford’s market share increase by 40 basis points to 12.6%. Global sales of hybrid vehicles saw a significant boost, rising by 30% YoY, with the hybrid mix projected to reach 9% in 2024.
The Ford Pro segment, which focuses on commercial motor and EV vehicles and services, recorded a 13% YoY revenue growth, totaling $15.7 billion with earnings before interest and taxes (EBIT) of $1.8 billion, yielding an 11.6% margin. Ford Pro Intelligence, the software platform supporting its digital services, saw a 30% YoY increase in paid software subscriptions, now numbering around 630,000.
On the other hand, the Model E EV segment experienced an EBIT loss of $1.2 billion. Although it achieved $500 million in cost improvements YoY, widespread pricing pressures overshadowed these gains. Still, the segment is on a better trajectory, with a $1 billion cost improvement noted for 2024.
Forecasting 2024: Cautious Projections Ahead
For 2024, Ford anticipates an adjusted EBIT of $10 billion, revised downward from a previous range of $10 billion to $12 billion. Adjusted free cash flow is expected to fall between $7.5 billion and $8.5 billion. Capital expenditures (CapEx) projections range from $8 billion to $8.5 billion, down from an earlier outlook of $8 billion to $9 billion. Additionally, full-year EBIT expectations include around $9 billion for Ford Pro, about $5 billion for Ford Blue, and a loss of approximately $5 billion for Model E. Earnings from Ford Credit are anticipated to be around $1.6 billion.
Anatomy of F Stock: Descending Triangle Pattern Emerges
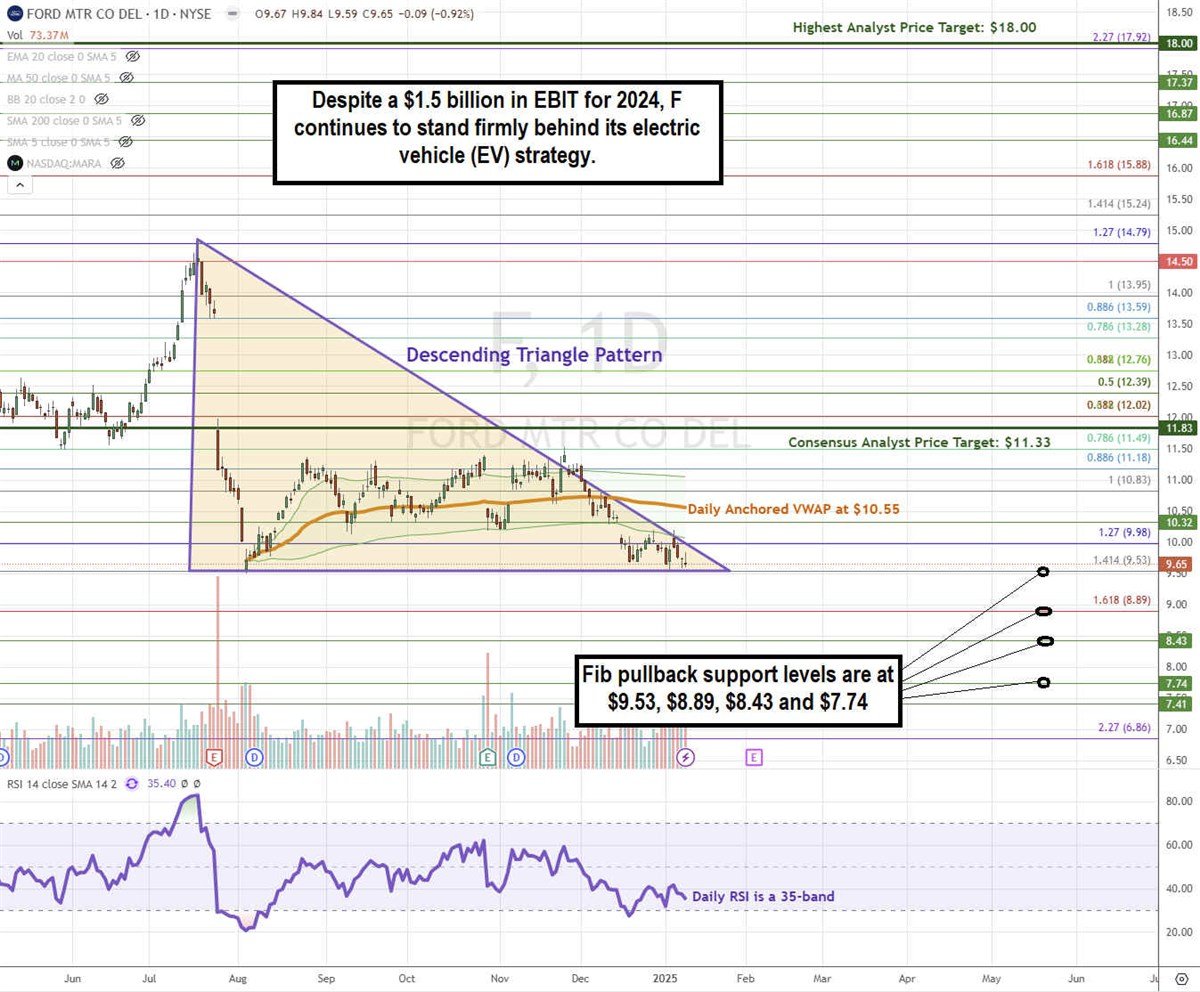
F stock has formed a descending triangle chart pattern, typically seen as a bearish indicator. This pattern features lower highs against a flat bottom support level. A breakout occurs if the stock surpasses the upper trendline resistance, while a breakdown happens if it falls below the lower trendline support.

Currently, F stock’s descending upper trendline resistance is positioned at the $14.79 Fibonacci level, meeting the flat bottom lower trendline support at the $9.52 Fibonacci level. The channel is narrowing as it approaches the apex point. The daily anchored VWAP resistance is gently declining at $10.55, while the daily RSI hovers around the 35-band. Fibonacci pullback support levels stand at $9.53, $8.89, $8.43, and $7.74.
The average analyst consensus price target for F stock is $11.83, suggesting a 22.5% upside potential. The highest target is $18.00, with three analysts advising a Buy rating, seven recommending Hold, and four suggesting Sell. Current short interest sits at 2.85%.
Actionable Options Strategies: Investors with a bullish outlook may consider cash-secured puts at the Fibonacci pullback support levels to capitalize on potential dips. If assigned shares, they could then implement a wheel strategy by writing covered calls at the upside Fibonacci levels, benefiting from the substantial 6.21% dividend yield.
The views and opinions expressed herein are the views and opinions of the author and do not necessarily reflect those of Nasdaq, Inc.


