Cleveland-Cliffs Faces Market Challenges Following Earnings Release
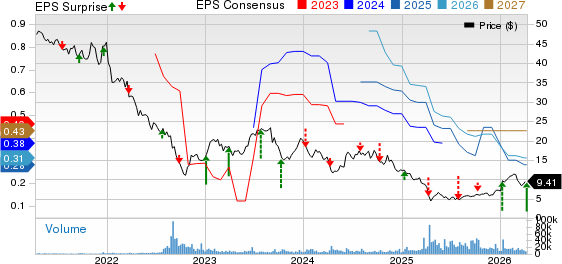
Cleveland-Cliffs (NYSE:CLF) experienced a 15% decline within a month of its earnings announcement on February 24. The company reported a loss of $0.68 per share, exceeding expectations for a loss, and fell short of revenue forecasts. This underperformance has significantly shaken investor confidence. Currently, the global steel market grapples with diminished demand and oversupply, which continue to push steel prices down. Given that Cleveland-Cliffs relies heavily on raw materials, these challenging circumstances have a pronounced impact on the company. However, domestic producers like Cleveland-Cliffs could see some benefits from tariffs on imported steel. – see Buy Cleveland-Cliffs Now for a comprehensive analysis. Enhancing investor strategy with a focus on historical performance may be beneficial.
It’s essential to recognize that in a downturn, Cleveland-Cliffs has previously faced fierce stock fluctuations. As recently as 2022, stock prices plummeted by 60% within a matter of quarters. In this volatile market, investors seeking reduced risk should consider the High-Quality Portfolio, which has outperformed the S&P 500 with returns exceeding 91% since its inception.

Image by Bakhrom Tursunov from Pixabay
What Does This Mean for Investors?
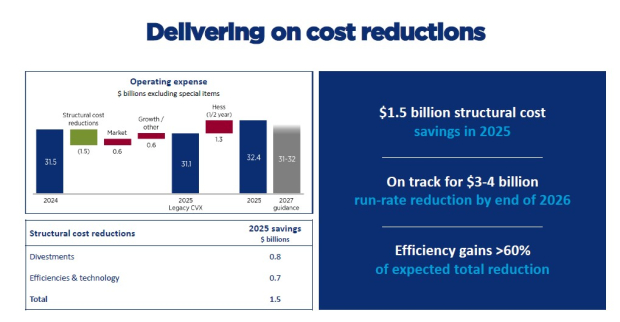
While Cleveland-Cliffs has introduced a $1.5 billion stock buyback initiative and highlighted potential growth in steel demand, the risk factors for the U.S. economy deserve consideration.
What Should You Be Aware Of? While inflation concerns have eased, they haven’t been eliminated. The latest politically charged actions, especially regarding tariffs and immigration, have reignited inflation fears. This scenario casts uncertainty over the U.S. economy, raising the risk of a potential recession. An analysis of macroeconomic conditions highlights these critical uncertainties. The ongoing Ukraine-Russia conflict, trade policies, and negotiations involving allies like Canada, Mexico, and Europe only add to this complexity.
What Specifics About Cleveland-Cliffs Stock Raise Concerns?
CLF stock has underperformed compared to the benchmark S&P 500 during recent downturns. As investors hope for a smooth economic transition, they must ask: how severe will the impact be if another recession occurs? Our dashboard, “How Low Can Stocks Go During A Market Crash,” offers insights into CLF’s performance during previous downturns.
Inflation Shock (2022)
- CLF stock dropped 64.1% from $33.07 on March 28, 2022, to $11.87 on November 3, 2022, compared to the S&P 500’s peak-to-trough decline of 25.4%.
- The stock has not recovered to its pre-Crisis high, with a subsequent peak of $22.83 on April 3, 2024, and current trading around $10.
Covid Pandemic (2020)
- CLF stock fell 59.6% from $7.60 on February 19, 2020, to $3.07 on March 23, 2020, while the S&P 500 experienced a 33.9% decline.
- The stock fully recovered to its pre-Crisis peak by October 7, 2020.
Global Financial Crisis (2008)
- CLF stock plunged 89.9% from a high of $119.19 on June 30, 2008, to $12.01 on March 2, 2009, versus the S&P 500’s 56.8% decline.
- It has not recovered to its pre-Crisis high.
Strategies for Wealth Preservation
Currently, Cleveland-Cliffs stock is relatively undervalued, trading at approximately 0.26x last year’s sales. Nonetheless, the company faced declining revenues last year, and forecasts indicate only about 7% growth this year. While Cleveland-Cliffs stands to gain from recently implemented tariffs, investors should consider their capacity to endure potential drops in stock prices—whether to $8, $5, or lower. Holding onto a declining stock is challenging. Trefis collaborates with Empirical Asset Management, a Boston-based wealth manager, whose asset allocation strategies delivered positive returns during the tumultuous 2008-2009 period when the S&P lost over 40%. This partnership employs the Trefis HQ Portfolio within its asset allocation to foster enhanced returns with reduced risk compared to the benchmark index.
With uncertainty surrounding a possible recession, it is vital to assess how previous market crashes unfolded. See how the last six market downturns compare.
| Returns | Mar 2025 MTD [1] |
2025 YTD [1] |
2017-25 Total [2] |
| CLF Return | -6% | 8% | 27% |
| S&P 500 Return | -5% | -4% | 153% |
| Trefis Reinforced Value Portfolio | -6% | -8% | 552% |
[1] Returns as of 3/18/2025
[2] Cumulative total returns since the end of 2016
Invest with Trefis Market-Beating Portfolios
Explore Trefis Price Estimates
The views and opinions expressed herein are the views and opinions of the author and do not necessarily reflect those of Nasdaq, Inc.