KLA Corporation’s Shares Surge but Signs of a Potential Decline Emerge
KLA Corporation KLAC is experiencing a significant increase in share price on Thursday. This uptrend follows strong earnings reports from Taiwan Semiconductor Manufacturing Company Limited TSM, which exceeded market expectations.
Technical Analysis Points to Possible Market Shift
However, KLA Corporation may soon face a downturn. This prompted our technical analysis team to select it as our Stock of the Day.
Understanding Stock Momentum
Momentum reflects how much a stock’s price has risen or fallen in a specified time frame. Typically, stocks remain within a certain trading range.
When sellers drive the price below this range, the stock is regarded as oversold. Conversely, if buyers push the price above this range, traders consider it overbought.
These dynamics are crucial. Many trading strategies are predicated on the idea of reversion to the mean. Stocks identified as overbought or oversold often revert back to their average trading levels.
The Tools of the Trade
There exist numerous methods for measuring a stock’s momentum, known as momentum indicators or oscillators.

A Word of Caution for New Traders
Many new traders fall into the trap of using too many indicators. They often believe that a deeper dive into analysis will yield better results.
Yet, it may be more beneficial for them to focus on a few key indicators and thoroughly understand them.
Key Indicators to Watch
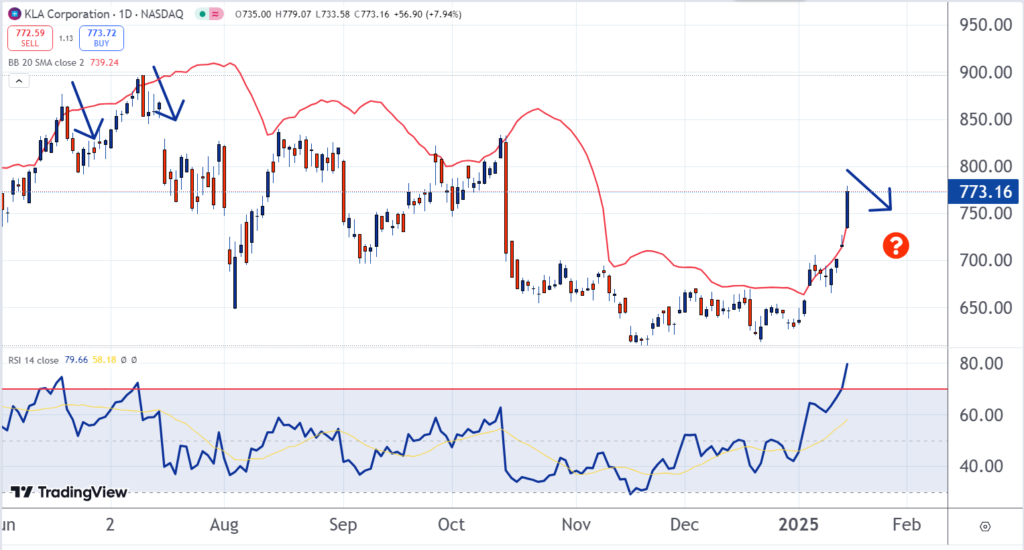
The chart features the Relative Strength Momentum Indicator (RSI) at the bottom. This popular tool shows when the market is overbought or oversold. Currently, the blue line surpasses the horizontal red line, indicating overbought conditions.
Another notable element is the red line, which represents a Bollinger Band. This is a widely used method for gauging momentum and situates two standard deviations above the 20-day moving average. Statistical principles suggest that 95% of trading lies within two standard deviations of the mean.
When the stock goes beyond this threshold, it is identified as overbought. Presently, that condition applies to KLA Corporation.
The last two occasions when KLA Corporation registered overbought signals from both indicators resulted in subsequent sell-offs. There’s a possibility this trend may repeat.
Additional Reading:
Read Next: Polar Vortex Brings Winter’s Coldest Air For Trump’s Inauguration Day: What It Means For Utilities, Retailers, Energy Stocks
Photo: JHVEPhoto via Shutterstock
Market News and Data brought to you by Benzinga APIs


