Lucid Group Reports Wider Loss Despite Revenue Increase
Overview of Lucid Group’s Q1 2025 Performance
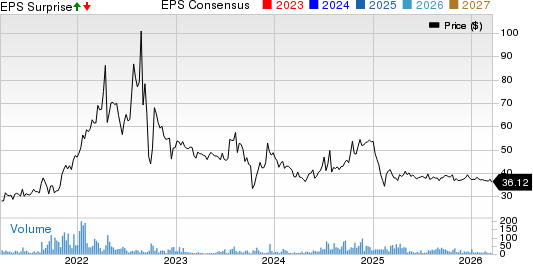
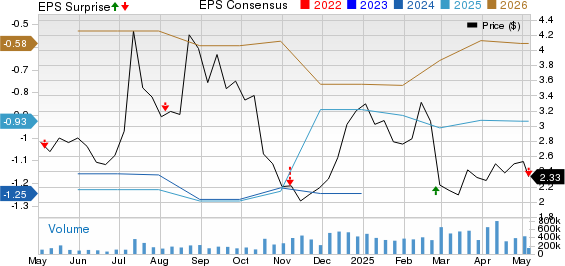
Lucid Group (LCID) announced a first-quarter 2025 loss of 24 cents per share. This figure was wider than the Zacks Consensus Estimate of a 23-cent loss but better than the 30-cent loss reported in the same period last year. Total revenues for the quarter reached $235.05 million, falling slightly short of the Zacks Consensus Estimate of $236.10 million, although this represented a 36% increase year-over-year, driven by stronger vehicle deliveries.

Lucid Group, Inc. price-consensus-eps-surprise-chart | Lucid Group, Inc. Quote
Key Highlights for Q1 2025
In Q1 2025, Lucid produced a total of 2,212 vehicles. The company delivered 3,109 units of the Lucid Air, marking a notable 58% increase compared to the previous year.
The total gross loss for the quarter was $228.5 million, an improvement from the $232 million gross loss reported a year ago. The gross margin was negative 97%, which is an improvement over the previous year’s negative 134.5%.
Operating expenses were $463.4 million, down from $497.8 million in the same quarter last year. Research and development costs came in at $251.2 million, compared to $284.6 million in Q1 2024. Selling, general, and administrative expenses totaled $212.2 million, down slightly from $213.2 million a year earlier.
Adjusted EBITDA for the company was a negative $563.5 million, improving from negative $598.4 million in the first quarter of 2024.
Net cash used in operating activities was $428.6 million, down from $516.7 million in Q1 2024. Capital expenditures totaled $161.2 million for the quarter, compared to $198.2 million in the prior year. Free cash flow was a negative $589.8 million.
As of March 31, 2025, Lucid had $1.85 billion in cash and cash equivalents, up from $1.6 billion at the end of 2024. The company ended Q1 with total liquidity of $5.76 billion, with long-term debt remaining stable at $2 billion.
For 2025, Lucid forecasts production of approximately 20,000 vehicles. The company holds a Zacks Rank of #3 (Hold).
Recent Performance Updates from the Automotive Sector
Tesla (TSLA) reported a first-quarter 2025 earnings per share of 27 cents, missing the Zacks Consensus Estimate of 44 cents and decreasing from 45 cents a year ago. Total revenues were $19.33 billion, falling short of the consensus mark of $21 billion and down 9% year-over-year. Tesla plans to pilot robotaxi services in Austin by June but may adjust its 2025 delivery volume guidance due to global tariff disruptions and challenges in its China operations.
As of March 31, 2025, Tesla’s cash, cash equivalents, and investments stood at $37 billion, a slight increase from $36.5 billion on December 31, 2024. Long-term debt and finance leases totaled $5.3 billion, down from $5.7 billion as of December 31, 2024.
PACCAR Inc. (PCAR) reported earnings of $1.46 per share for Q1 2025, missing the consensus estimate of $1.57 and down from $2.27 from the previous year. Total consolidated revenues were $7.44 billion, a decline from the $8.74 billion reported in the same quarter last year, with truck-related sales of $6.91 billion.
PACCAR’s cash and marketable securities were $8.1 billion as of March 31, 2025, down from $9.65 billion at the end of 2024. The company anticipates capital expenditures between $700-$800 million for 2025 and has adjusted its R&D spending estimates to $450-$480 million.
General Motors (GM) reported adjusted earnings of $2.78 per share for Q1 2025, surpassing the Zacks Consensus Estimate of $2.69 and improving from $2.62 in the prior year. Revenues reached $44.02 billion, exceeding the consensus estimate of $42.5 billion and up from $43.01 billion the previous year. However, adjusted EBIT was $3.49 billion, lower than $3.87 billion in the prior-year quarter.
As of March 31, 2025, General Motors held $20.57 billion in cash and cash equivalents, and the long-term automotive debt totaled $13.44 billion. The company’s adjusted automotive free cash flow for the first quarter was $811 million, down from $1.09 billion a year ago.
Conclusion
Investors and analysts are closely watching the performance of these automakers as they navigate challenges and adjust their strategies amid a changing market landscape.
The views and opinions expressed herein are the views and opinions of the author and do not necessarily reflect those of Nasdaq, Inc.