High Options Trading Volume Highlights Activity in Major Stocks
Newmont Corp, Antero Resources Corp, and Home Depot Inc Stand Out in the Russell 3000 Index
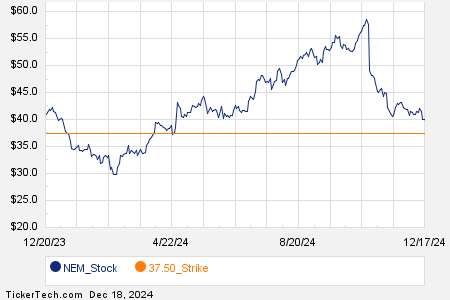
Among the stocks in the Russell 3000 index, noteworthy options trading activity emerged today, particularly for Newmont Corp (Symbol: NEM). A total of 52,507 contracts have changed hands, equivalent to about 5.3 million underlying shares. This figure represents approximately 54.9% of NEM’s average daily trading volume over the last month, which was 9.6 million shares.
The $37.50 strike put option with an expiration date of March 21, 2025, experienced significant activity. So far today, 5,675 contracts have been traded, representing roughly 567,500 underlying shares of NEM. Below is a chart showing NEM’s trailing twelve-month trading history, with the $37.50 strike option highlighted in orange:

Antero Resources Corp (Symbol: AR) also saw considerable trading interest, with a volume of 19,642 contracts exchanged. This represents about 2.0 million underlying shares or 54.5% of AR’s average daily trading volume of 3.6 million shares over the past month.
The $39 strike call option set to expire on February 21, 2025, witnessed particularly high activity, with 14,090 contracts traded. This translates to approximately 1.4 million underlying shares of AR. Below is a chart depicting AR’s trailing twelve-month trading history, with the $39 strike highlighted in orange:

In a notable development, Home Depot Inc (Symbol: HD) reported a trading volume of 17,146 contracts today. This number reflects about 1.7 million underlying shares, or 52.6% of HD’s monthly average daily trading volume of 3.3 million shares.
The $420 strike call option expiring December 20, 2024, was particularly active, with 2,522 contracts traded, equating to approximately 252,200 underlying shares of HD. The following chart illustrates HD’s trailing twelve-month trading history, with the $420 strike highlighted in orange:

For more information on the available expirations for options on NEM, AR, or HD, visit StockOptionsChannel.com.
![]() Today’s Most Active Call & Put Options of the S&P 500 »
Today’s Most Active Call & Put Options of the S&P 500 »
Also see:
NLSP Average Annual Return
Funds Holding FNBC
ETFs Holding RCI
The views and opinions expressed herein are the views and opinions of the author and do not necessarily reflect those of Nasdaq, Inc.

