Unlocking Seasonal Trading Strategies for Smart Investors
Editor’s Note: Long-time followers know my focus on seasonal market patterns.
Many popular phrases about stock market seasonality exist. Some are based on historical trends, while others may not hold much value.
Having been involved in the market for over four decades, I’ve observed consistent seasonal patterns among stocks throughout the year.
Learning how to leverage these patterns could lead to significant profits. Being a “numbers guy,” I believe the data speaks for itself.
That’s why I’m thrilled to share insights from our partners at TradeSmith.
On January 8, TradeSmith CEO Keith Kaplan will reveal a way to identify the top trading opportunities among 5,000 stocks, with 83% backtested accuracy, regardless of market conditions.
This innovative tool is so significant that Keith refers to it as his “life’s work.” Make sure you don’t miss this opportunity.
Click here to register for the webinar!.
The best part? Signing up lets you test the tool for free!
Meanwhile, I’ve asked Keith to explain more about TradeSmith’s groundbreaking development.
Over to you, Keith
***************************
A new year brings many uncertainties, which can create tension in the market.
In the third quarter, just before the election, we saw the VIX spike, investor confidence waver, and uncertainty about Federal Reserve actions weighed heavily.
However, once those uncertainties dissipated, the market surged forward with remarkable energy.
Knowledge can effectively ease the anxiety related to the unknown.
While some aspects of 2025 remain unpredictable, at TradeSmith, we recently achieved our biggest breakthrough ever…
We have developed a method to identify the optimal times of year to buy and sell any asset, based on clear, measurable patterns.
Let me share how this works.
Planting for Profit
On the surface, stocks appear to fluctuate randomly, rising one day and dropping the next—even after good news.
Yet, certain stocks consistently experience significant movement during specific times of the year, allowing you to plan a profitable trading strategy.
This rhythm resembles how farmers schedule their planting. They cannot always predict the weather or guarantee that every field will yield a good harvest.
Still, they know the best time to plant is in spring, a seasonal pattern that mankind has adapted to for centuries.
Farmers prepare their fields between March and May, care for crops from June to August, and harvest from September to November, adjusting based on the crop.
Remarkably, this reliable behavior creates predictable cycles in agricultural prices. Harvesting time often leads to decreased prices, as supply tends to exceed demand, at least temporarily.
Similar seasonal patterns exist in the stock market. Like farmers, you can pinpoint the best times to buy or sell various stocks down to the exact day.
We will provide a webinar in January, and you can explore our TradeSmith Seasonality tool. To gain access and participate, sign up for the webinar.
This innovative tool reveals consistent patterns that can assist you in making sound investment decisions regarding stocks you own or those you are considering.
With the New Year approaching, new cycles are ready to begin.
Kickstart Your Year
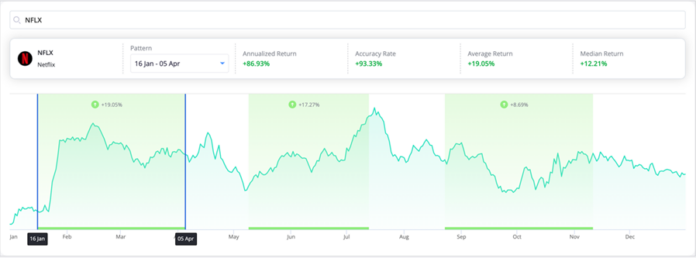
Consider Netflix (NFLX) as a case in point.
The well-known streaming service typically experiences a surge in stock price starting in January. This first seasonal opportunity is marked in green on our TradeSmith Seasonality chart:


But what makes January through April so favorable for NFLX? Possibly its earnings reports or the release of popular new shows early in the year.
The exact reasons may vary, and the specific “why” isn’t as crucial. Historical data shows that NFLX has risen an average of 19% between January 16 and April 5 over the past 15 years. We can draw informed conclusions from this observation.
Could it repeat this trend in 2025? While there are no guarantees, the bullish seasonal pattern boasts a 93.3% success rate.
Now let’s explore another example: cybersecurity firm Fortinet (FTNT).
Unlocking Seasonal Trading: A New Method for Higher Returns
The Power of Seasonal Patterns in Stocks
Exploring seasonal patterns in stocks can provide valuable insights for traders. A recent TradeSmith analysis identified 22 stocks with strong bullish patterns that typically start in January, with gains averaging between 10% and 20% over the initial months.
Gaining Precision in Trading Decisions
Many traders recognize that seasonality influences stock performance, but few can pinpoint specific dates for optimal trading. While some can identify strong sectors for certain seasons, they often lack the detailed data needed to determine the best days for specific stocks. At TradeSmith, we’ve gathered extensive data to highlight those optimal trading days, showcased as green zones on our charts.
Introducing a Groundbreaking Trading Strategy for 2025
Excitingly, this new approach may represent one of TradeSmith’s most significant breakthroughs. With this knowledge, we aim to make confident trade recommendations for 2025, foreseeing which stocks are likely to yield high-probability trades months in advance.
Simple Yet Effective: The Two-Step Trade Selection Process
Our analysis led us to a straightforward two-step process for selecting trades. Over an 18-year backtest, this method produced a positive average return of 5.96% per year, with an average holding period of 19 days. Achieving consistent wins could potentially result in an impressive annualized return of 118%.
Backtest Performance: Solid Returns Compared to the S&P 500
Even during the challenging year of 2007, the worst in our backtest, average trades still yielded a return of 2.5%, allowing for an annualized return of 37.9%. This performance far surpasses what the S&P 500 typically offers, especially during tough market years. Over the 18-year testing period, our strategy demonstrated remarkable growth of 857%, more than double the S&P’s performance during the same timeframe.

Join Us for an Exclusive Strategy Session
On Wednesday, January 8, at 10 a.m. Eastern, we’ll reveal more about this trading strategy. This session will detail how we find reliable stocks to trade on their best days. Don’t miss your chance to explore these new seasonality signals—our key breakthrough for 2025—by registering to attend for free.
Looking forward to your participation,

Keith Kaplan
CEO, TradeSmith

