DNOW Inc Surpasses 200-Day Moving Average, Shares Soar
Strong Performance Signals Investor Confidence
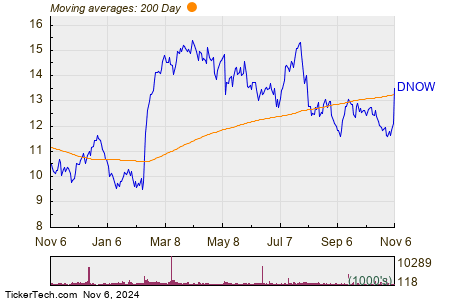
In trading on Wednesday, DNOW Inc (Symbol: DNOW) saw its shares rise above the crucial 200-day moving average of $13.28, reaching a peak of $13.48 per share. Currently, DNOW shares are up approximately 10.6% for the day. The chart below illustrates the one-year performance of DNOW shares in relation to their 200-day moving average:

Examining the chart, DNOW’s 52-week low stands at $9.44 per share, while its 52-week high reaches $15.645. The latest trade shows DNOW shares at $13.52.
 Click here to discover which 9 other energy stocks recently crossed above their 200-day moving average »
Also see:
- Cheap Energy Stocks Paying Dividends
- Top Ten Hedge Funds Holding CART
- RE Market Cap History
The views and opinions expressed herein are the views and opinions of the author and do not necessarily reflect those of Nasdaq, Inc.
5 Stocks Our Experts Predict Could Double In the Next Year
By submitting your email, you'll also get a free pivot & flow membership. A free daily market overview. You can unsubscribe at any time.