
Palo Alto Networks Set to Report Earnings with Strong Historical Performance
Palo Alto Networks (NASDAQ: PANW) will release its earnings report on Tuesday, May 20, 2025. Historically, the stock tends to move positively after earnings announcements. Over the past five years, PANW achieved a positive one-day return in 70% of these occurrences, with a median positive return of 7.4% and a maximum one-day positive return of 18.6%.
Understanding Historical Data for Trading Strategies
For event-driven traders, these historical trends may provide a trading advantage. Traders can consider two main approaches: first, by taking a position before the earnings release to leverage the historical likelihood of a positive reaction; second, by assessing the correlation between immediate post-earnings returns and medium-term performance to enhance trading strategies following the announcement.
Current Earnings Projections
Analysts expect earnings per share (EPS) of $0.77 on revenue of $2.28 billion for the upcoming report. This indicates growth compared to the same quarter last year, which reported an EPS of $0.66 on revenue of $1.98 billion.
Palo Alto Networks holds a market capitalization of $127 billion. Its revenue over the trailing twelve months is $8.6 billion, showing operational profitability with $942 million in operating profit and a net income of $1.3 billion.
Analysis of Historical One-Day Returns
Examining one-day post-earnings returns reveals the following:
- In the last five years, there were 20 earnings data points recorded, with 14 positive and 6 negative one-day returns. Positive returns occurred approximately 70% of the time.
- Considering only the last three years, the positive return percentage decreases slightly to 67%.
- The median of the 14 positive returns stands at 7.4%, while the median of the 6 negative returns is -3.0%.
Further statistics regarding five-day (5D) and twenty-one-day (21D) returns following earnings are summarized in the table below.
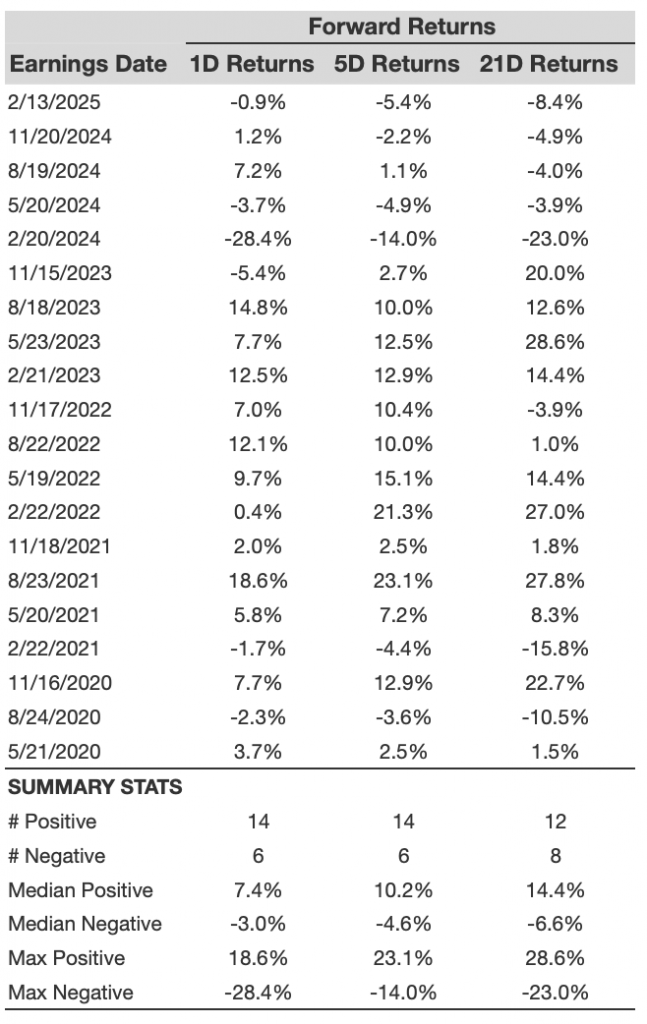
PANW 1D, 5D, and 21D Post-earnings Return
Correlation of Post-Earnings Returns
A less risky strategy is to understand the correlation between short-term and medium-term returns after earnings. Identifying a pair with high correlation allows traders to execute informed trades. For example, if the 1D and 5D returns show strong correlation, a trader may decide to go “long” for the next five days if the 1D post-earnings return is favorable. Correlation data based on five-year and three-year histories can provide additional insights.

PANW Correlation Between 1D, 5D, and 21D Historical Returns
Impact of Peer Performance on Post-Earnings Reactions
Peer performance can influence stock reactions following earnings reports. Often, market pricing begins before these announcements. Historical data comparing Palo Alto Networks’ stock performance with peers that reported earnings shortly before it will help assess possible correlations. Peer stock returns also represent post-earnings one-day returns for a fair comparison.
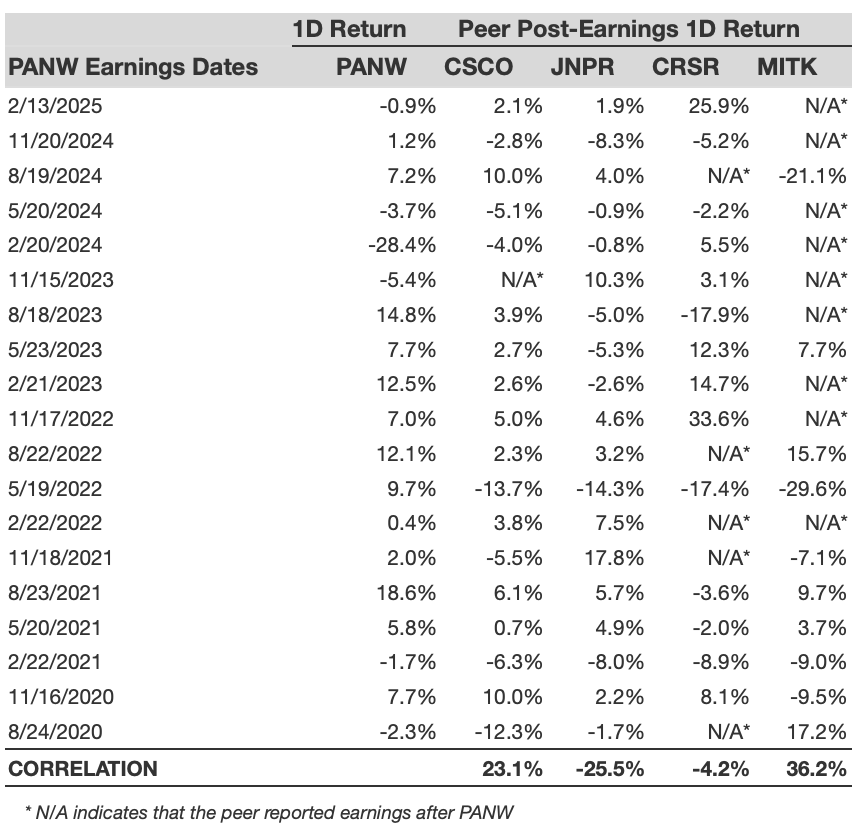
PANW Correlation With Peer earnings
The views and opinions expressed herein are the views and opinions of the author and do not necessarily reflect those of Nasdaq, Inc.


