Welcome to part 3 of our exploration into the indicators that can be constructive tools for forecasting economic slowdown and recession. We are digging into measures that pack a real punch in anticipating shifts in the economy, unlike many lagging indicators. These underrated metrics hold the potential to guide investors with their portfolio management decisions, as they have been meticulously backtested against the S&P 500 index.
As seen in Part 1, we delved into the Yield Curve and demystified the need for a more intricate understanding of this measure to harness its forecasting potential. In Part 2, we proposed a contrarian approach to recession forecasting, advocating skepticism toward the traditional channels which, led by entities such as the NBER dating committee, often lag behind in declaring a recession.
In this phase, we articulate the specific measures that warrant attention and scrutiny, offering a clearer gauge of economic sentiments, especially within the bond market. We are venturing into the depths where these strategies can be indicative of upcoming equity returns.
Auto Demand: Unveiling the Cipher
In Nicholas Napier’s book Anatomy of the Bear: Lessons from Wall Street’s Four Great Bottoms, an analytical dissection of over 70,000 articles and periodicals vividly illustrates the markers of a bear market. One crucial sign of an approaching market downturn is exuberant investor sentiment juxtaposed with underlying economic fragility.
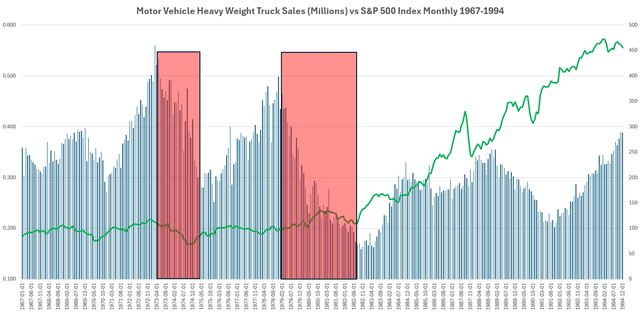
Two key indicators, auto demand and heavy truck demand, offer valuable insights into market shifts. Preceding a recession, heavy truck demand typically experiences a significant decline for several months. Here are two compelling charts outlining this trend:
1967-1994 Period
1994-2023 Period
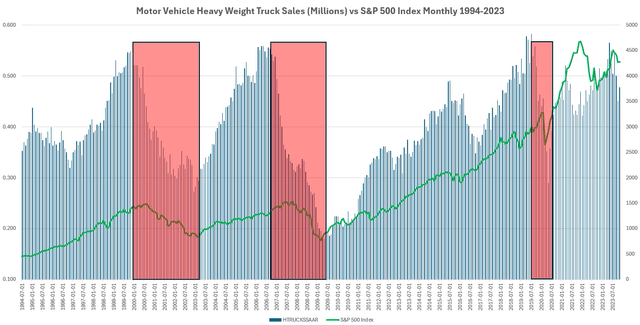
In major bear markets, which inflict substantial damage on portfolios, heavy truck sales peak at a rate exceeding 0.5 or 500k annually, thereafter plummeting significantly to the 0.3-0.2 range, reflective of reduced demand for goods and services, and consequently, trucks for transportation.
Heavy Truck demand emerges as a vital indicator to monitor in 2024. In May 2023, it peaked above 0.5 and currently stands at 0.478 for November 2023. Typically, there is a decline of 0.1-0.15 or 100k-150k sales prior to the onset of a recession. Although not signaling an imminent sell-off, it serves as an amber warning as we observe its trajectory.
Total Vehicle Sales also offer valuable insights, especially in indicating the timing of a market bottom. During the 2022 dip, a keen observation reveals that total vehicle sales swiftly halted any recession concerns, as auto demand bottomed out and began to rise for the remainder of the year.
Credit Spreads: Unveiling Market Pulsations
The US Bond Market, boasting a colossal $51.3 trillion in assets as of Q3 2022, lays claim to being the largest financial market globally. Surprisingly, the Chinese bond market follows closely, with $20.9 trillion in assets.
Consequently, comprehending the signals emanating from this pivotal market becomes a prerogative. There lies an element of alpha here. For instance, scrutinizing high yield corporate debt indexes in comparison to benchmark Corporate credit indexes can offer valuable insights into the point where institutions, the pulse-keepers of the debt market, commence shunning riskier debt. As the yield on high yield debt rises significantly, it indicates a sell-off of high yield bonds (bond yields move inversely to bond prices).
This phenomenon often correlates with financial crises.
Let’s consider the ICE BofA High Yield Index, depicting the variance between the yield on standard corporate debt and the high yield index of the market:
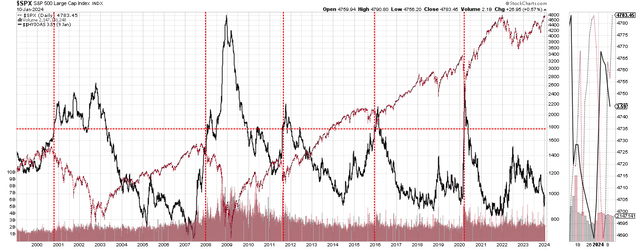
As observed, when the black line representing the High Yield Index surges above a certain level, an ensuing economic crisis unfolds. This emerges as an invaluable confirmation tool. With current credit spreads lingering at all-time lows, the likelihood of a financial crisis appears minimal, courtesy of the stable bond markets with no indications of a “flight to safety” away from the riskier domains of the credit market.
This indicator continues to signal a green light, appearing a considerable distance away from posing any concerns.
Grounded Assessment with OFR Financial Stress Index
Expanding on the perspective of credit spreads, the Office of Financial Research houses a multifaceted model, delineating the significance of monitoring “financial stress” within the system. This multi-factor index provides a glimpse into the degree of market strain, as thoroughly elucidated in a separate article. Let’s delve into its present state:
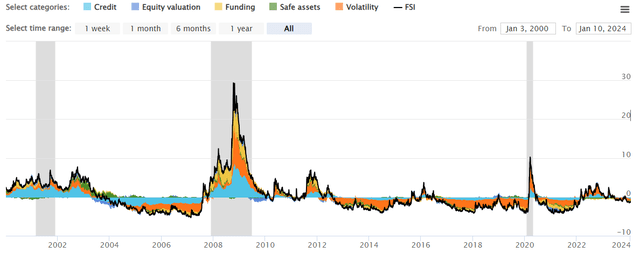
With the OFR FSI index perched at -1.38, any figure below 0 implies favorable conditions. A retrospective view demonstrates how the bear markets of 2000-2003 and 2007-2009, in addition to the Euro debt crisis and the Covid Crash, were heralded by an uptick in financial strain.
The ongoing scenario depicts no substantial issues, presenting a smooth sailing with a resounding “buy” signal.
Empower Your Insights with Informed Data
To sum up, entrusting the mainstream media or financial pundits to navigate the economic landscape yields little value. As elucidated in the preceding article of Part 2, their track record for prognosticating about the economy or stock market is abysmal, often leading the public astray about the future.
Nonetheless, there exist exceptional and forward-looking indicators that demand vigilant monitoring. We explored the nuances of auto demand, particularly emphasizing the Heavy Truck Sales index and US Total Vehicle Sales. Furthermore, in the credit markets, the ICE BofA High Yield Index emerges as a pivotal barometer for comprehending stress within the credit domain, notably highlighting its current stability. Our prior coverage of the Financial Stress Index is also a crucial reference, consolidating multiple credit spreads and interest rate measures into one comprehensive Index (including the High Yield Index itself).
In the forthcoming series, we will assimilate Net Liquidity and build upon the groundwork laid here to craft an inclusive overview of a repertoire of measures imbued with forecasting power for the stock market’s trajectory.
5 Stocks Our Experts Predict Could Double In the Next Year
By submitting your email, you'll also get a free pivot & flow membership. A free daily market overview. You can unsubscribe at any time.