Surge in Options Trading Activity for Zeta Global, Spotify, and Bloom Energy
High Contract Volumes Indicate Increased Investor Interest
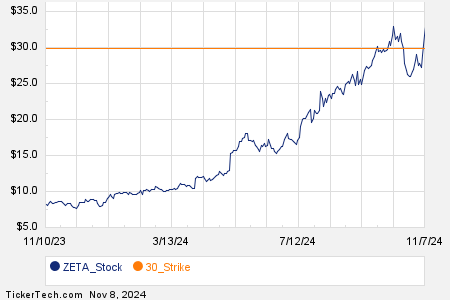
Today, Zeta Global Holdings Corp (Symbol: ZETA) is making headlines with significant options trading. A total of 27,833 contracts has been exchanged, which translates to around 2.8 million underlying shares since each contract represents 100 shares. This trading activity accounts for 75.7% of ZETA’s average daily trading volume of 3.7 million shares over the past month. Notably, the $30 strike put option expiring on November 15, 2024, saw a remarkable 7,827 contracts traded, representing about 782,700 underlying shares of ZETA. The following chart illustrates ZETA’s trading history, with the $30 strike highlighted in orange:

Spotify Witnesses Active Options Market
Spotify Technology SA (Symbol: SPOT) shows options trading volume at 10,347 contracts, equaling about 1.0 million underlying shares and approximately 73.6% of SPOT’s average daily volume, which is 1.4 million shares. One highlight of today’s activity includes the $390 strike call option expiring on December 20, 2024, with a total of 443 contracts trading, representing around 44,300 underlying shares of SPOT. Below is a chart showcasing SPOT’s trading history, with the $390 strike highlighted:

Bloom Energy Sees Record Option Activity
Bloom Energy Corp (Symbol: BE) is also experiencing robust trading, with 46,344 contracts traded today. This amounts to approximately 4.6 million underlying shares or about 73.3% of BE’s average daily volume of 6.3 million shares over the last month. The $12 strike call option expiring on November 15, 2024, displays particularly strong interest, with 5,375 contracts traded, equating to roughly 537,500 underlying shares of BE. A chart featuring BE’s trading history, with the $12 strike highlighted, can be found below:

Explore More Options Data
To find additional information on available expirations for ZETA, SPOT, or BE options, visit StockOptionsChannel.com.
![]() Today’s Most Active Call & Put Options of the S&P 500 »
Today’s Most Active Call & Put Options of the S&P 500 »
Also see:
- NFC Historical Stock Prices
- VSTM Average Annual Return
- WTRG Average Annual Return
The views and opinions expressed herein are those of the author and do not necessarily reflect those of Nasdaq, Inc.


