Invesco S&P 500 High Dividend Low Volatility ETF Hits Oversold Levels
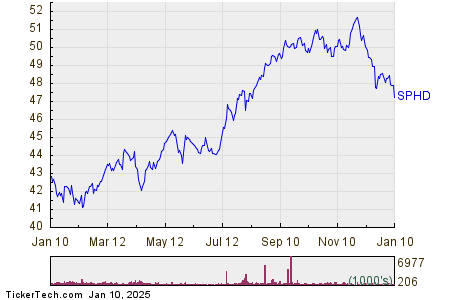
On Friday, trading revealed that shares of the Invesco S&P 500 High Dividend Low Volatility ETF (Symbol: SPHD) fell into oversold territory, reaching a low of $47.345 per share. An indicator known as the Relative Strength Index (RSI) is used to determine this situation, measuring stock momentum on a scale from zero to 100. Stocks are deemed oversold when their RSI dips below 30.
Currently, SPHD’s RSI reads at 28.5, indicating a more significant downturn than the S&P 500, which sits at an RSI of 40.5.
This low RSI reading could signal to bullish investors that the recent selling may soon end, providing a potential opportunity for purchasing shares.
Moreover, a glance at SPHD’s one-year performance chart reveals that its lowest point over the past 52 weeks was $40.84, while its highest reached $51.89. As of the last trade, the ETF was priced at $47.26, reflecting a drop of 1.1% for the day.

Discover Oversold Stocks: Free Monthly Report on Top 8%+ Dividends
![]() Explore nine other oversold stocks to consider »
Explore nine other oversold stocks to consider »
Related Articles:
- Top Ten Hedge Funds Holding ESGU
- Institutional Holders of HSKA
- IYG Historical Stock Prices
The views and opinions expressed herein are those of the author and do not necessarily reflect those of Nasdaq, Inc.

