FICO Reports Strong Q4 Growth Despite Minor Earnings Miss
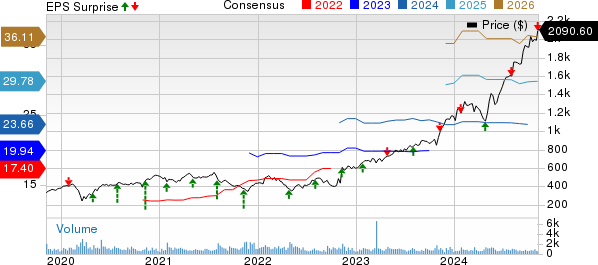
Fair Isaac (FICO) announced its fourth-quarter fiscal 2024 earnings of $6.54 per share. Although this figure fell short of the Zacks Consensus Estimate by 0.91%, it marks an impressive 30.5% increase from the same period a year ago.
Discover the latest EPS estimates and surprises on Zacks Earnings Calendar.
FICO’s revenues climbed to $454 million, reflecting a year-over-year growth of 16.4%, yet they missed the consensus expectation by 0.21%. The company reported that the Americas, EMEA, and Asia Pacific accounted for 85%, 10%, and 5% of total revenues, respectively.
Following a strong performance in the fourth quarter, FICO raised its earnings guidance for fiscal year 2025, a sign that could please investors. The company’s shares have surged 79.6% this year, significantly outperforming the Zacks Computer & Technology sector, which saw a return of 25.1%.
FICO Pricing, Consensus, and EPS Surprise Overview

Fair Isaac Corporation price-consensus-eps-surprise-chart | Fair Isaac Corporation Quote
Detailed Revenue Breakdown for FICO
In the fourth quarter, software revenues, which encompass Fair Isaac’s analytics and digital decision-making technology along with related services, improved by 5.4% year over year, reaching $204.6 million.
Software Annual Recurring Revenues (ARR) grew by 8% compared to the previous year. This includes a notable 31% growth in platform ARR, while non-platform ARR showed no growth. The Software Dollar-Based Net Retention Rate stood at 106% during this period, with platform software achieving impressive retention at 123% and non-platform at 99%.
The on-premises and SaaS software segment, which constitutes 40% of total revenues, increased by 7.5% year over year to $181.7 million. However, professional services, making up 5% of revenues, fell 9.1% year over year to $22.9 million.
Scores, which represent 54.9% of total revenues, saw a robust increase of 27.4% year over year, amounting to $249.2 million. Notably, B2B scoring solutions experienced a 38% year-over-year increase, propelled by higher unit prices. Conversely, B2C revenues dipped 1% due to reduced volumes on myFICO.com.
In an encouraging development, mortgage origination revenues soared by 95% year over year. This segment was responsible for 47% of B2B revenues and 37% of total scores revenues. However, auto origination revenues edged down by 2% year over year, while credit card and personal loan revenues fell by 5% year over year.
During this fourth-quarter period, FICO witnessed increased customer adoption of FICO Score 10 T specifically for mortgage origination. The company welcomed new clients and fostered further adoption from existing ones, reinforcing its stronghold in the mortgage sector.
Additionally, FICO formed significant partnerships with Tata Consulting Services and iSON Xperiences, aiming to broaden its platform business and extend its customer reach.
Operating Performance Insights at FICO
Research and development expenses, as a percentage of revenues, decreased by 90 basis points year over year, now sitting at 9.7%.
In contrast, selling, general, and administrative expenses rose by 160 basis points year over year to 27.1%. Operating margins stood at 43.4% for the quarter, reflecting a year-over-year improvement of 90 basis points.
FICO’s Financial Position and Cash Flow Analysis
As of September 30, 2024, FICO reported $151 million in cash and cash equivalents, while total debt amounted to $2.2 billion. This is a slight decline from June 30, 2024, when cash and cash equivalents were $156 million with total debt at $2.1 billion.
Cash flow from operations reached $226.4 million in the fourth quarter, compared to $213.3 million from the prior quarter. Free cash flow also increased to $219.4 million, up from $205.7 million in the previous quarter.
During this period, FICO repurchased 188,000 shares.
FICO’s Guidance for Fiscal Year 2025
Looking ahead, FICO has set its revenue expectations at $1.98 billion for fiscal 2025.
Projected non-GAAP earnings are estimated at $28.58 per share.
FICO’s Market Ranking and Alternative Investments
FICO currently holds a Zacks Rank #2 (Buy).
Shopify (SHOP), BiliBili (BILI), and NVIDIA (NVDA) are other notable stocks that investors might explore within the same sector. While SHOP enjoys a Zacks Rank #1 (Strong Buy), both BILI and NVIDIA hold Zacks Rank #2 as of now. For a complete list of today’s Zacks #1 Rank stocks, visit the link provided.
Shopify shares have appreciated 4.9% year to date, and it is scheduled to release its third-quarter 2024 results on November 12.
Bilibili shares have soared 82% year to date, and its third-quarter 2024 report is expected on November 14.
NVIDIA shares have experienced a remarkable 194% gain year to date, with its third-quarter fiscal 2025 results due on November 20.
Explore Investment Opportunities in the Nuclear Energy Sector
The demand for electricity continues to rise rapidly, sparking a shift towards reducing reliance on fossil fuels. Nuclear energy emerges as a leading alternative.
Recently, leaders from the U.S. and 21 other nations pledged to triple global nuclear energy capacities, indicating substantial potential for profits in nuclear-related stocks for early investors.
Check out our report, Atomic Opportunity: Nuclear Energy’s Comeback, to learn about key players and technologies in this sector, featuring three standout stocks with strong growth potential. Download your free report today.
Get the latest recommendations from Zacks Investment Research. Download our report on 5 Stocks Set to Double, available for free.
NVIDIA Corporation (NVDA) : Free Stock Analysis Report
Fair Isaac Corporation (FICO) : Free Stock Analysis Report
Shopify Inc. (SHOP) : Free Stock Analysis Report
Bilibili Inc. Sponsored ADR (BILI) : Free Stock Analysis Report
To read this article on Zacks.com, click here.
Zacks Investment Research
The views and opinions expressed herein are the views and opinions of the author and do not necessarily reflect those of Nasdaq, Inc.

