CrowdStrike Holdings, Inc. CRWD saw a significant drop in its stock price on Friday, spurred by reports of insider selling.
This situation serves as a compelling case study in technical analysis, making it our Stock of the Day.
Understanding Market Psychology Through Stock Patterns
One key aspect of technical analysis is its fractal nature, which illustrates that the same patterns appear on charts across different timeframes.
In the market, prices tend to find support at levels that previously served as support. This behavior is rooted in investor psychology, particularly the sentiment of remorseful sellers.
Many traders who sold stocks at certain support levels often regret their decision when prices rebound quickly. This regret leads them to repurchase shares if they can reacquire them at the original selling price.
Consequently, when stock prices return to these previously established levels, an influx of buy orders may emerge, hardening that support once again.
Related Article: Airline Stocks Outperform Tech In 2024: Holiday Travel ‘Expected To See Records This Year’
Recent Stock Performance
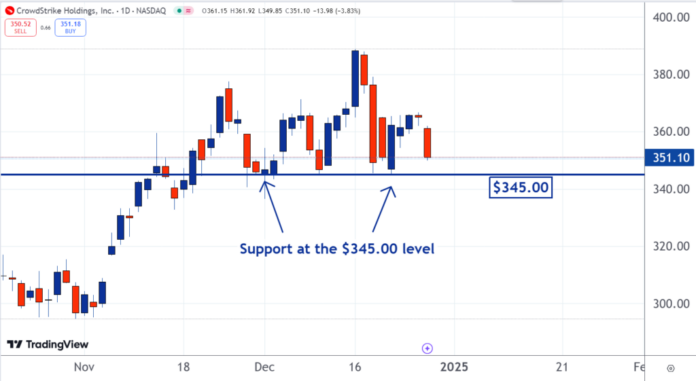
Looking at the last four months, CrowdStrike’s stock has shown support around the $345.00 mark. This trend reflects the remorse felt by swing traders, who typically aim for gains over weeks or months.

4-month chart
Insights from the One-Day Chart
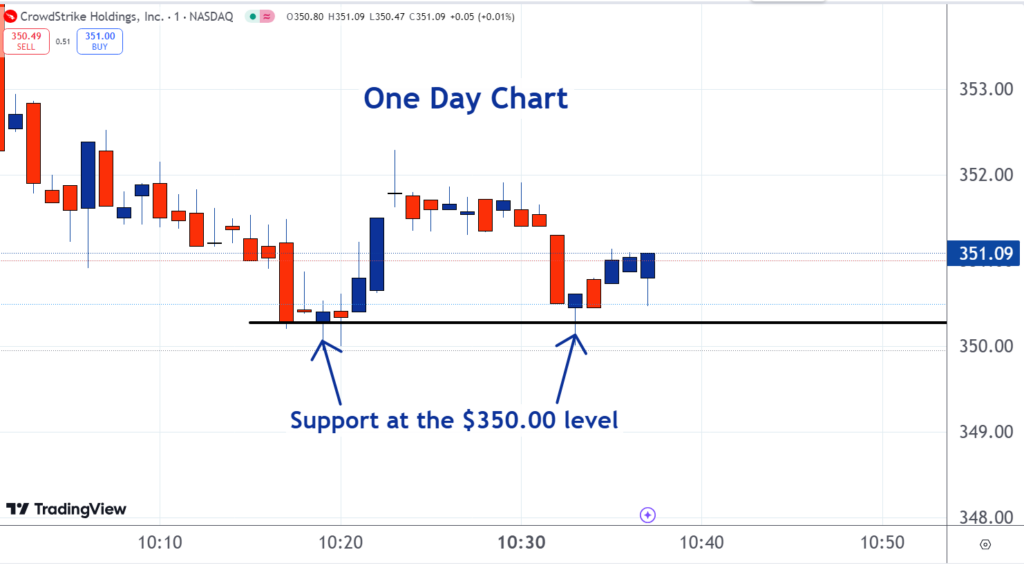
Similar dynamics can be observed in the one-day chart, with $350.00 acting as a support level. This stronger support reflects the activities of day traders with shorter-term objectives.

The Importance of Understanding Technical Analysis
Technical analysis often faces skepticism on Wall Street, which can be attributed to a lack of understanding of its principles. When applied correctly, it reveals the psychology of investors and traders, depicted through a series of charts.
Across various trading strategies, the emotions experienced by participants are consistent. This universality accounts for the repetitive patterns observed in charts, regardless of the timeframe involved.
Read Next:
Image: Shutterstock
Overview Rating:
Speculative
Market News and Data brought to you by Benzinga APIs

